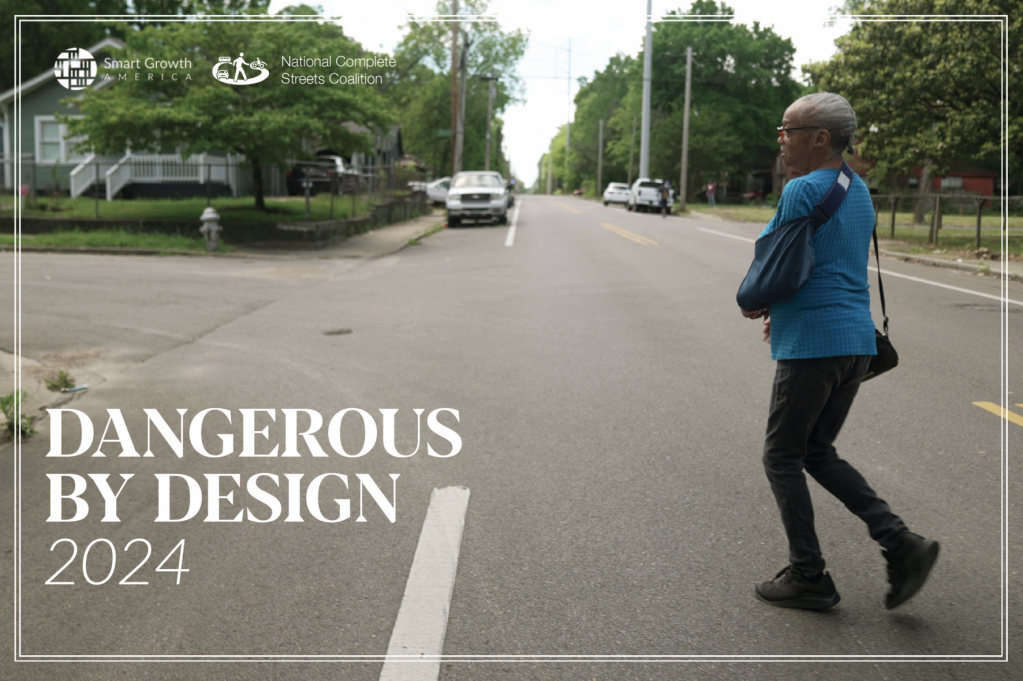
Report: Pedestrian Deaths at a Forty-Year High
Note: A previous version of this post had an error in the chart at the end; it has been corrected.
California claims the dubious distinction of having five of its metropolitan areas land on Smart Growth America’s list of the top twenty most dangerous cities for pedestrians. Bakersfield (#4), Fresno (#7), the Inland Empire (#12), Stockton (#19), and the Sacramento/Roseville/Folsom (#20) all experienced between three and four pedestrian deaths per 1,000 people in the period between 2018 and 2022.
But even those California cities whose dire fatality rates did not earn them a spot at the very top of the list show an alarming long-term trend of increasing fatalities. Out of the 101 cities analyzed and ranked by Smart Growth America, very few showed a downward trend in pedestrian death rates, and none of those were in California.
Across the U.S., 2022 averaged more then twenty people killed on streets every day, marking a forty-year high. “The country’s largest metro areas are significantly more dangerous than a decade or more ago, says the report. “But just because a metro area is ranked lower than in years prior, it’s not necessarily any less deadly than before—it’s just that other metros have had bigger increases.”
These daunting numbers are explored by Kea Wilson at Streetsblog USA, who offers a reminder that they are likely underreported, and they do not account for the devastation wrought by severe injuries that don’t result in deaths.
Numbers and rankings are meaningless to those who are suffering from long-term disability, or the loss of a loved one, due to traffic injuries. And while the data can show who is most vulnerable – low-income people of color – it’s not much comfort to those already affected by bad policies, bad street designs, and apathy from engineers and elected officials.
The report finds that dangers in urban areas are increasing faster than in rural areas. Since 2013, total pedestrian deaths are up by nearly 61 percent in urban areas, compared to 41 percent in rural areas.
It also finds that most of the traffic deaths – 66 percent of them – occur on state-owned roads; these include freeways as well as some streets function as main streets through cities.
Anyone walking or riding a bike in U.S. cities already knows that navigating hostile streets comes with the territory, and is likely aware that dangerous driving is increasing. The effort it takes to change the status quo in terms of street design – to get cities and departments of transportation to redesign existing streets so they are slower and safer – is daunting in the face of resistance to change from many quarters. But Smart Growth America sees hope in the incremental progress in some U.S. communities, where there is an effort to shift transportation systems towards a focus on the safety of people who aren’t protected by a two-ton steel cage. But reversing decades of planning that prioritizes people over cars is clearly taking too long.
Below are pedestrian death rates in the largest California metro areas. The 2024 report compares the rates between 2018 and 2022 to the previous Dangerous by Design report, which analyzed rates between 2013 and 2017. The last column on the right shows the difference between those two – the higher the number, the higher the death rate is rising. None of the California metro areas showed a declining trend.
| U.S. Rank | Metro Area | Avg Annual Pedestrian Fatality Rate per 100K people 2018-2022 | Pedestrian Deaths 2018-2022 | Pedestrian Deaths 2013-2017 | Long-term Trend in Pedestrian Fatality Rates |
| 4 | Bakersfield | 3.99 | 181 | 151 | 0.55 |
| 7 | Fresno | 3.89 | 196 | 111 | 1.60 |
| 12 | Riverside-San Bernardino-Ontario | 3.46 | 797 | 572 | 0.90 |
| 19 | Stockton | 3.23 | 126 | 89 | 0.78 |
| 20 | Sacramento-Roseville-Folsom | 3.15 | 377 | 238 | 1.05 |
| 27 | San Diego-Chula Vista-Carlsbad | 2.83 | 466 | 351 | 0.70 |
| 30 | Los Angeles-Long Beach-Anaheim | 2.63 | 1723 | 1449 | 0.44 |
| 48 | San Jose-Sunnyvale-Santa Clara | 1.98 | 196 | 166 | 0.29 |
| 63 | San Francisco-Oakland-Berkeley | 1.64 | 384 | 375 | 0.02 |
| 77 | Oxnard-Thousand Oaks-Ventura | 1.45 | 61 | 50 | 0.27 |
Smart Growth America will host a webinar to discuss the report on June 6 at 10 a.m. California time. Register here.

Streetsblog has migrated to a new comment system. New commenters can register directly in the comments section of any article. Returning commenters: your previous comments and display name have been preserved, but you'll need to reclaim your account by clicking "Forgot your password?" on the sign-in form, entering your email, and following the verification link to set a new password — this is required because passwords could not be carried over during the migration. For questions, contact tips@streetsblog.org.