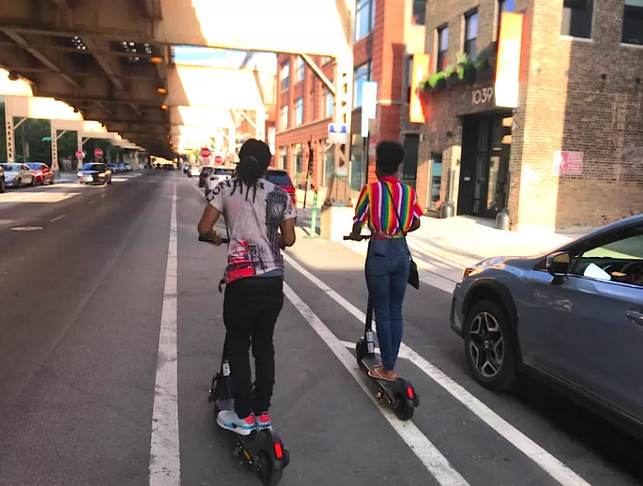
As Chicago’s dockless electric scooter pilot winds down to its eventual end on October 15, we’ve started to gain further understanding of the devices’ impact on our city. The report “A Day in the Life of Chicago’s E-Scooter Pilot Program” by DePaul’s Chaddick Institute director Joseph Schwieterman and assistant director C. Scott Smith, was just published this week. The study took a look at scooter use between 7 a.m. and 7 p.m. on Wednesday, July 24, with data collected at two-minute intervals. The study has some key findings regarding deployment of scooters, popular locations for scooter usage, and the times of day customers are using them.
According to the report, e-scooter companies are generally deploying fewer e-scooters than the allowed 250 per operator. The total number of scooters deployed varied from a maximum of 1,631 at 11:51 a.m. to a minimum of 1,339 at 6:28 p.m. The average number of scooters deployed on the street was 1,486.
The number of e-scooters deployed varied by operator. For the July 24 snapshot, Wheels had an average of 283 scooters deployed, more than its permitted number. Clevr Mobility, on the other hand, had an average of only two scooters deployed. Lime had the second highest number of scooters deployed with an average of 221. Some reasons for numbers being lower than the maximum levels were offered in the study, which included higher-than-expected maintenance issues or a desire from operators to focus on particularly geographic areas.
One of the hopes of the e-scooter pilot is that the gadgets will provide an environmentally friendly option for first mile/last mile commutes to and from transit stations. The study indicates that scooters may be filling that gap in certain areas. 37 percent of trips occurred between 7 a.m. and 9 a.m. Meanwhile 23 percent of trips were taken between 5 and 7 p.m. According to the API (application programming interface) data, the mean distance was 2.0 miles.
Check out the study’s animation of scooter use on July 24 here.
The study also looked at popular origins and destinations for users. The Near West Side and West Town were the most popular origins and destinations, followed by Logan Square and Austin. Other neighborhoods that had high origins and destinations were North Lawndale, West Garfield Park, Hermosa, and Belmont Cragin.
It is unsurprising to see the Near West Side and West Town be the most popular origins and destinations, since they are sites with high-volumes of young professionals and also close to the downtown job center. The numbers starting and ending there far surpass all other neighborhoods.
However, the high use in lower-income communities, such as Austin and North Lawndale, is noteworthy. E-scooters riders are often stereotyped as affluent professionals, but I would be interested to learn more about how residents on the West Side and other Latinx communities on the Northwest Side are using e-scooters.
On a similar note, the study researchers used an economic hardship index to further examine distribution and use of e-scooters throughout various neighborhoods. The index was composed based on data from the 2017 American Community Survey 5-year estimates. Based on this index, the number of e-scooters in areas with high or very levels of economic hardship never falls below 40%. Slightly over 43% of e-scooters were in relatively affluent neighborhoods.
The study provided some promising data about the presence of e-scooters and their potential to be an asset for communities underserved by Divvy and transit. It provides us with a foundation for doing further research on the matter, particularly gathering qualitative data from communities to go along with it. My main interests upon reading the study is learning more about how lower-income communities of color are using the e-scooter and the perceptions and realities of safety while using them. These are important questions to consider as the pilot wraps up in a little over a month.
