Caltrans Report: Speeding and Aggressive Driving Cause Most Crashes
Caltrans crunched four-year-old collision data from the California Highway Patrol and found that nearly twenty percent of traffic-related fatalities and severe injuries are speed-related.
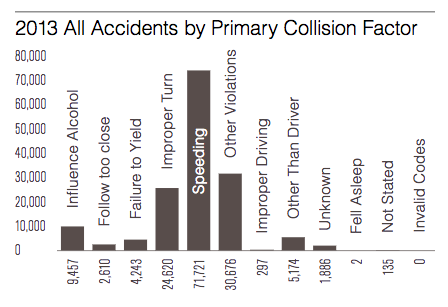
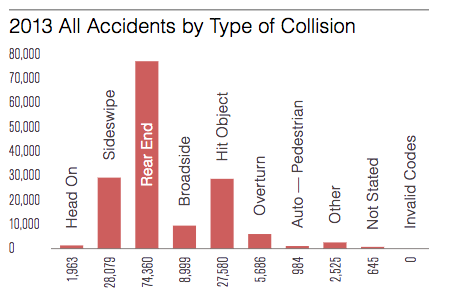
In the 2013 report, the most recent year for which data is available, more than 71,000 collisions were attributed to speeding. Likewise, rear-end collisions occurred far more often than “sideswipes,” the second-leading type.
But, the article continues,
Despite these seemingly large numbers, traffic-related fatalities on California’s highway system — and the nation as a whole — are actually continuing a downward trend.
That is, measuring since 1995, collisions resulting in fatalities and severe injuries declined by as much as 25 percent, despite a small uptick between 2010 and 2013.
It’s too bad there’s such a huge lag time in collecting information from the CHP. Other sources, such as the National Safety Council, have more recent data that shows national trends have continued that upward tick—and that they took a dramatic leap in the first six months of 2016.
Also unfortunately, the Mile Marker doesn’t help interpret the data. Why, for example, are rear-end crashes far and away the most common type? Could it have something to do with distracted driving? Or maybe it’s because drivers feel invulnerable after years of safety efforts that have focused on the occupants of cars–with airbags and seatbelts–but not on the people they hit?
And why, oh why, is Caltrans still calling crashes “accidents”?
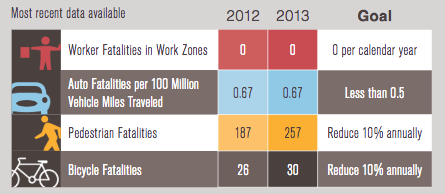
This Mile Marker also charts progress towards some of the department’s 2020 goals, including reducing pedestrian and bicycle fatalities—and let’s just say, there is a ways to go on that one. Fatalities rose between 2012 and 2013, rather dramatically, instead of dropping. What’s happened in the four years since?
The Mile Marker is a newish way for the department to get information out to the public about what it’s up to and why. Other articles in it don’t rely so heavily on old data. They include discussions of the California Sustainable Freight Action Plan and this year’s state budget, great photos of artworks on highway underpasses, and an outline of the California Transportation Plan 2040’s recommendations for reaching state greenhouse gas emission reduction targets.

Streetsblog has migrated to a new comment system. New commenters can register directly in the comments section of any article. Returning commenters: your previous comments and display name have been preserved, but you'll need to reclaim your account by clicking "Forgot your password?" on the sign-in form, entering your email, and following the verification link to set a new password — this is required because passwords could not be carried over during the migration. For questions, contact tips@streetsblog.org.