The state’s highest-ridership passenger rail system, BART, has experienced the slowest post-COVID ridership recovery in the nation. Its struggles are dominating headlines, as has Governor Gavin Newsom's reluctance to fully fund transit.
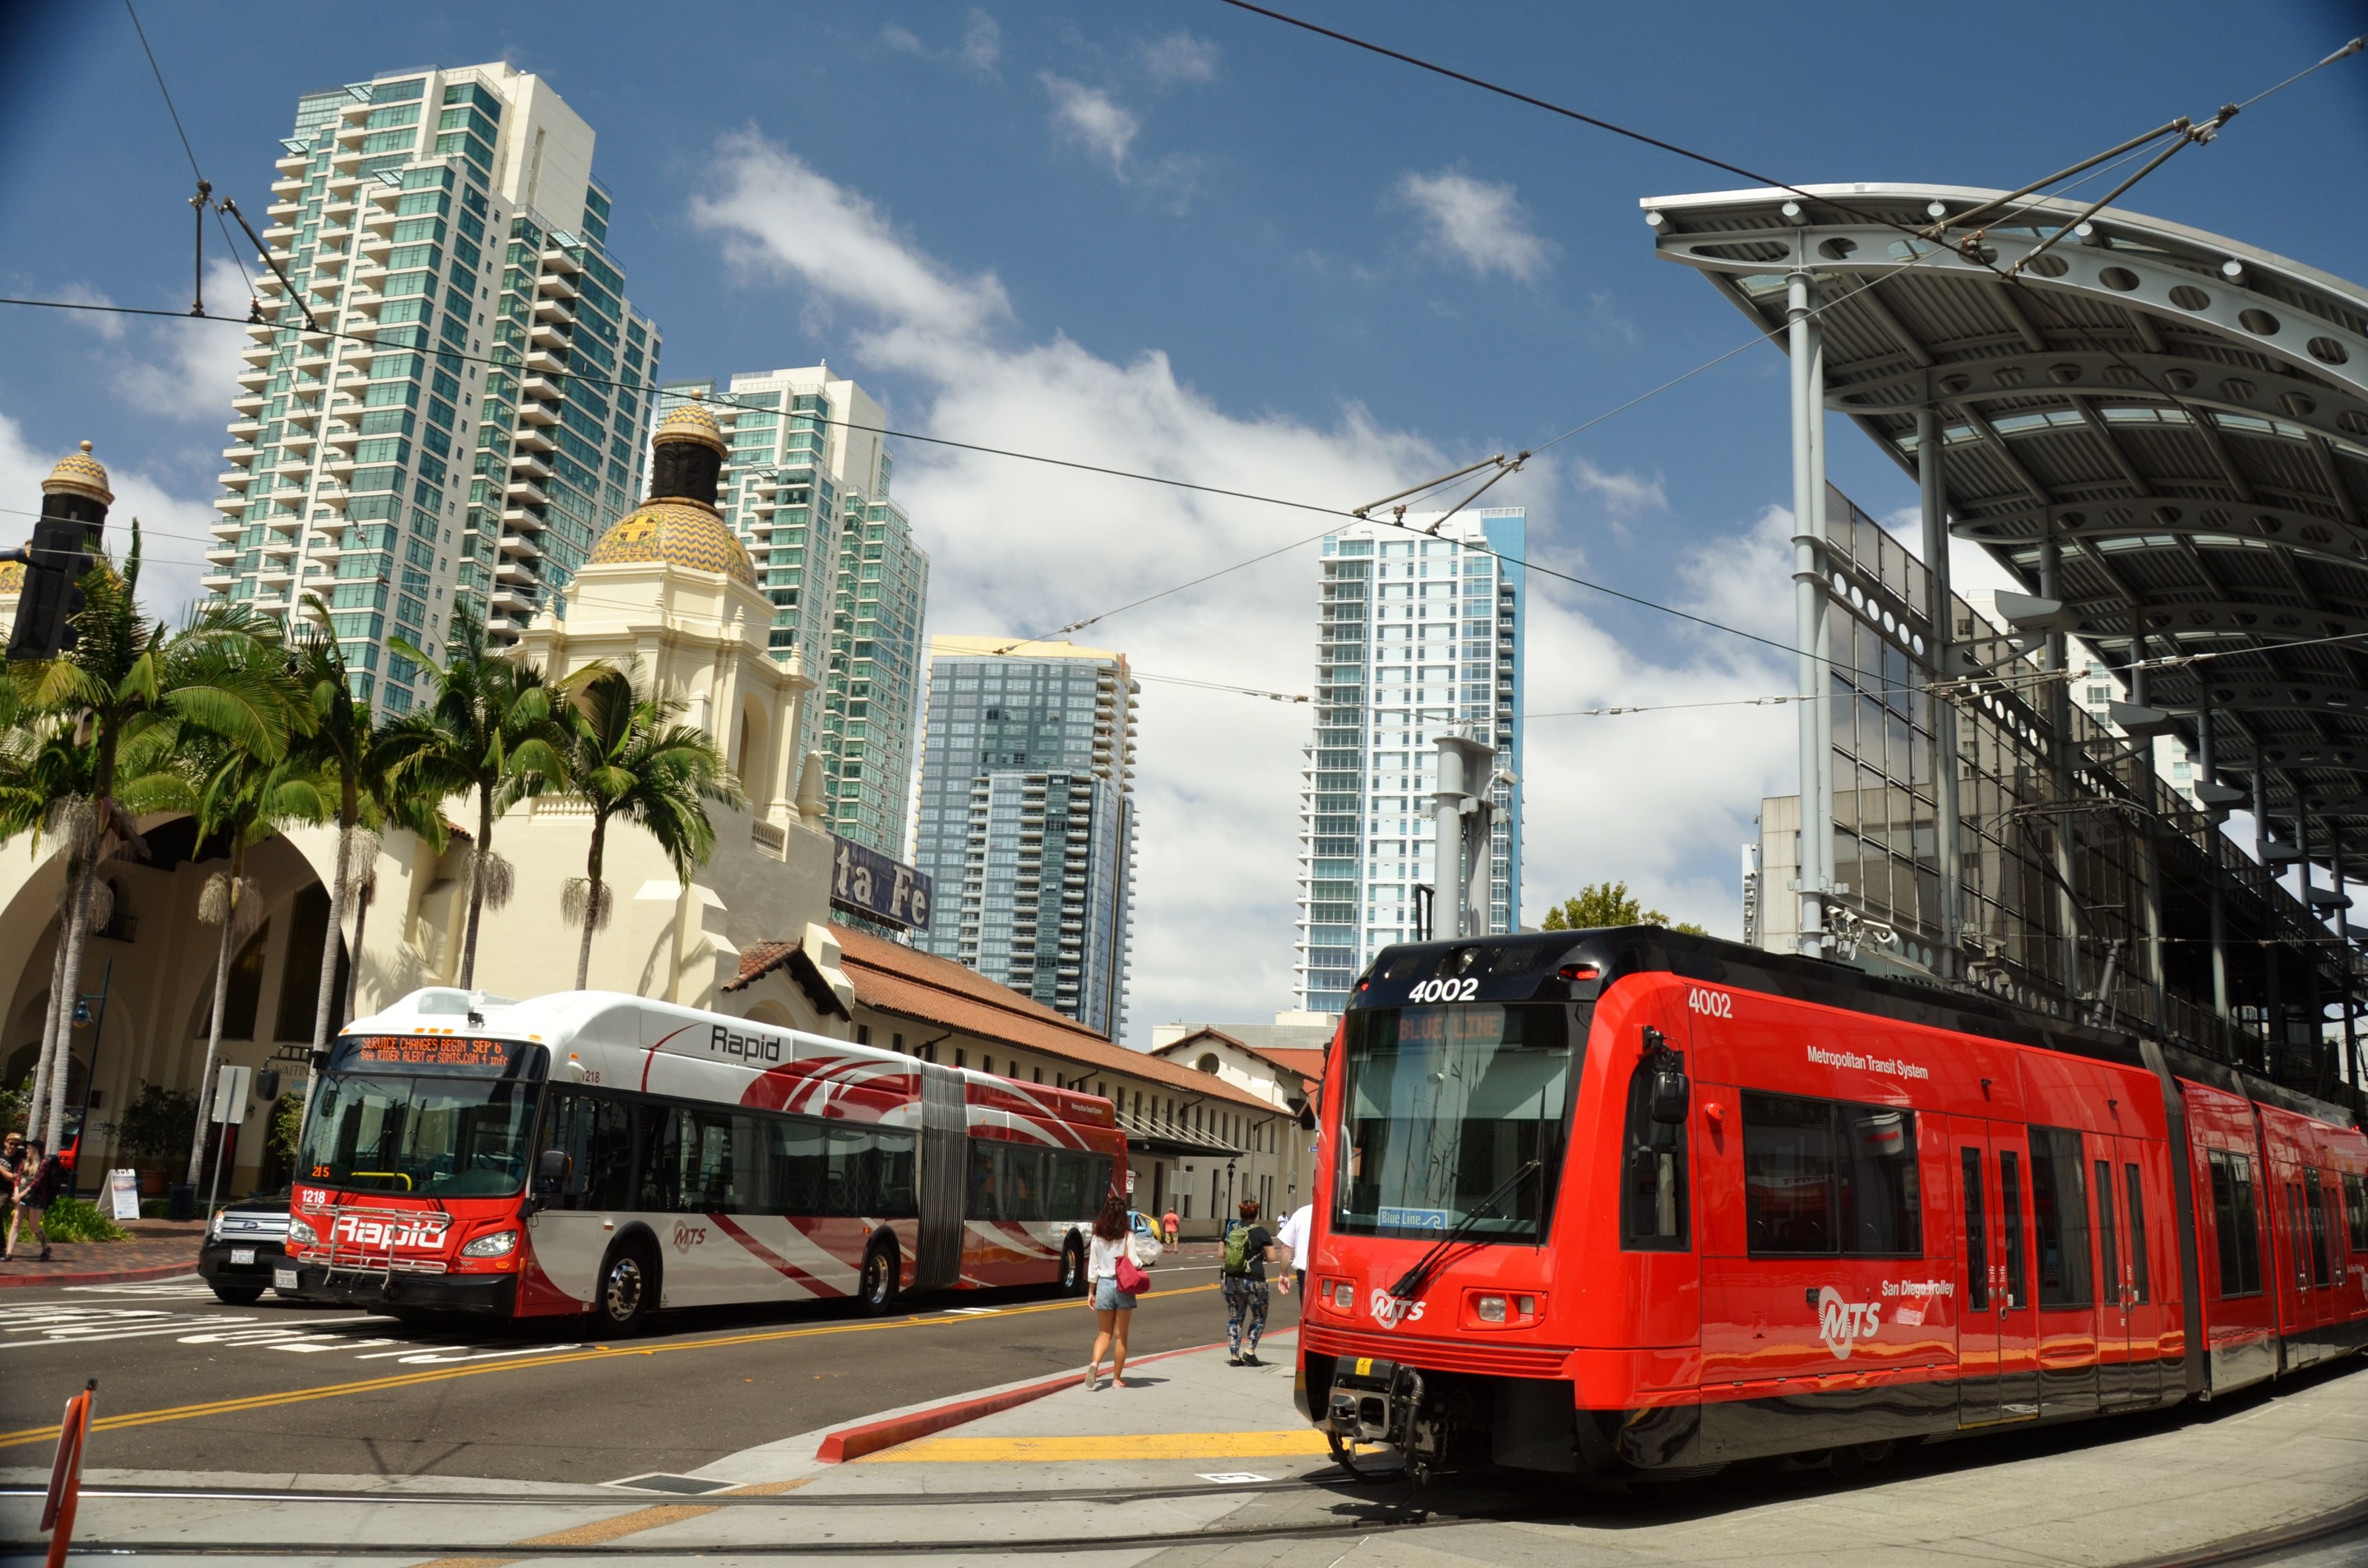
But California is also home to the city that has led the nation in ridership recovery - a recovery so spectacular that between 2019 and 2023, it jumped from fifth to first place in U.S. light rail ridership. That city is San Diego.
Superb Ridership Recovery
San Diego’s Trolley system's ridership recovery is leading not only the state but also the nation. Despite its fifth place in 2019 national light-rail ridership, the Trolley ranked first in both 2022 and 2023. This rebound is partly due to the new Mid-Coast Trolley, which opened in November 2021. But the National Transit Database (NTD) shows that even by the last quarter before the new line opened, the Trolley had recovered 63 percent of its 2019 ridership, behind only light rail systems in L.A. and New Jersey (both had recovered 65 percent of their ridership at that time). As of May 2024, the Trolley was at 112 percent of its May 2019 ridership - compared to 89 percent in Los Angeles and 120 percent in Seattle. And the latter two systems have opened multiple expansions since 2019. The San Diego Trolley is on track to break all-time record ridership at 43.6 million trips in 2025.
San Diego’s bus service has recovered a more modest 77 percent of its pre-pandemic ridership. But even so, total San Diego urban area transit ridership from January to June of 2024 was 89.2 percent of ridership over the same period in 2019. Compare that to the San Francisco/Oakland area (64 percent), Los Angeles (81.2 percent), and Sacramento (78.9 percent).
Superb Ridership Before COVID
But San Diego is not a case of a smaller transit system rebounding from the pandemic. Pre-COVID, San Diego was every bit as much a transit city as Minneapolis-St. Paul or Denver.
According to the NTD, San Diego's two transit systems exceeded the combined boardings of all seven Minneapolis-St. Paul agencies every year from 2015 through 2019.
Most remarkably, between 2015 and 2019, San Diego’s urban area per-capita transit ridership rivaled that of the Twin Cities, despite having a transit commute mode share of only three percent compared to the Twin Cities’ 5.3 percent.
And in 2019, the Trolley alone exceeded the combined ridership of Denver’s light rail and commuter rail, even though that year the Trolley had only 54.3 track miles while Denver had 60.1 miles of track in light rail alone.
San Diego Is Succeeding Against All Odds
Job density can be an even more powerful transit ridership generator than residential density. Yet San Diego had achieved relatively high ridership despite low job density. The Brookings Institute found that in 2017, 2.7 percent of all metro area trips in San Diego were made on transit. In the Twin Cities metro areas, the transit mode share was 2.5 percent that year, and it was 2.1 percent in Denver. And that's with a much smaller share of area jobs: only 3.6 percent of San Diego's jobs are located in its central business district. Compare that to Denver, where 9.3 percent of its jobs are in downtown, or the Minneapolis-St. Paul central business district, where 5.8 percent of area jobs are located.
Even the conservative, rail transit-skeptical Manhattan Institute’s 2018 analysis of 23 U.S. light rail systems identifies San Diego as the biggest outlier. As predicted by transit frequency and station-adjacent destinations, San Diego exceeded its expected ridership by a larger margin than any other system.
Lessons for the Rest of California
San Diego’s transit system has achieved relatively high ridership despite low job density because it excels at capturing non-commute trips. Transit agencies across California ought to emulate this success by tapping into the massive market of non-commute trips, which comprised about 77 percent of all trips nationwide in 2017.
While urban areas like Denver, San Francisco-Oakland, and Minneapolis-St. Paul saw non-commute transit trips in the region of fifty to sixty percent in 2017, in San Diego they comprised a whopping 74.3 percent of all transit trips.
Note that these numbers exclude the many Tijuana residents who commute to work in San Diego. While they contribute towards the 18,000 daily boardings at San Ysidro Transit Center, those trips are not included in the American Community Surveys where the commute-trip data comes from.
The San Ysidro Checkpoint border crossing, with about 25,000 pedestrian crossings every day, keeps the Blue Line busy even during off-peak hours. Average wait times for pedestrians at the border are often as long during off-peak hours and weekends as they are during peak hours. Contrast that with BART, where the famous Y-shaped system focuses on downtown San Francisco, leading to extremely crowded rush-hour trains into and out of the city, but very low midday, weekend, and contraflow ridership.
Service retention and expansion - despite the pandemic - was also instrumental in the Trolley’s strong recovery. In 2021, the Trolley had more vehicle revenue miles (VRM, the number of miles its vehicles travel while serving passengers) than it did in 2019. This increase was not solely due to the Mid-Coast Trolley opening. In January 2020, the agency increased midday weekday Trolley frequency on the Downtown-San Ysidro line from 15 to every 7.5 minutes, and late night frequencies rose from every thirty minutes to every fifteen. Given this corridor was already the Trolley’s busiest, increasing its frequency had a big impact on generating new ridership.
The Challenges for San Diego
Unfortunately, the foundation of San Diego’s epic ridership recovery - service retention and expansion - is being undermined by uncertain funding.
Prior to Governor Newsom’s sixty-day freeze on S.B. 125 funding, MTS had planned to use that money to increase frequencies: all late-night Trolleys would come every fifteen minutes, instead of thirty, starting in June 2024, and Mid-Coast Trolley peak trains would arrive every 7.5 minutes starting in June 2025. However, after the freeze was lifted, MTS shifted funds away from that plan and towards balancing its structural deficit. Even though MTS had its full funding restored, the sixty-day freeze spooked the agency. Uncertainty around future potential funding delays led MTS to reduce and delay planned service increases.
Nevertheless, even with S.B.125, MTS will face a deficit of $74.9M by 2029. Sadly, with San Diego being neither the state capital nor the state’s first or second largest metro area, operations funding for MTS is often an afterthought. If Governor Newsom and the legislature paid more attention to San Diego’s visionary and resilient transit system, they'd find a roadmap to grow ridership in post-COVID California, and perhaps they'd be much more eager to fund it.


