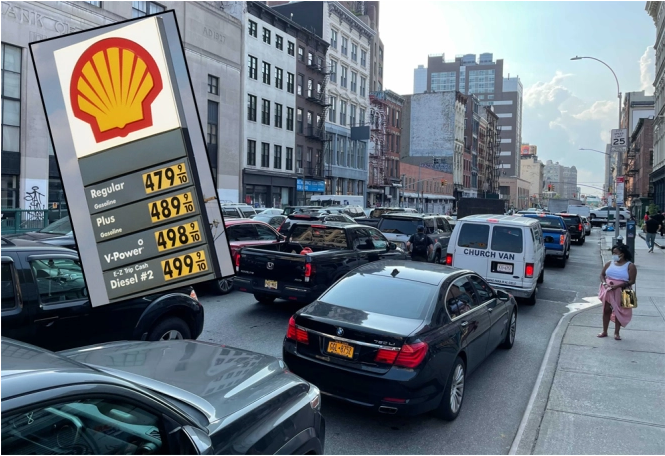
The average U.S. price at the pump is around 50 percent higher than this time last year. Will that lead to a discernible pullback in the amount that Americans drive?
I think not. Past price rises of that magnitude have led to only about a 4-percent immediate drop in gas consumption, mostly from reduced driving. (The remainder is families with multiple cars keeping the guzzler at home.) A 3- or 4-percent drop in driving is not nil, but it’s frustratingly small.
Longer-term impacts from higher gasoline prices are more pronounced, of course, as some car-buying and location decisions, and even a bit of infrastructure investment, shift toward the fuel-conserving part of the spectrum — more fuel-efficient cars, urban homes, more transit provision. But those, too, are modest: over a 10-year period, a 50-percent rise in gasoline prices tends to bring about only an 11- to 12-percent drop in gasoline usage, with around half of that decline, 6 percent, due to a drop in driving. The other half comes from switches to less fuel-consuming cars.
How do I know this? Well, “know” is perhaps too strong a word for economic modeling. But let me tell you how my model works, and you can judge for yourself.
The Komanoff model
I recorded annual data on U.S. gasoline purchases, total economic activity (aka gross domestic product), and the national average price of gasoline going back to 1960, then constructed a regression model that correlates year-to-year changes in gas consumption to changes in GDP and gas prices.
Since the price of gas tends to affect gas consumption in both short and long time frames, I created a second, supplementary gas-price variable by averaging, for each year, the prior decade’s year-to-year price changes.
Here’s what I found when I “regressed” annual changes in gasoline use to my GDP variable and two gasoline-price variables:
- an income-elasticity of 0.53, meaning that a 2-percent rise in (real) U.S. GDP tends to bring about a bit more than a 1-percent rise in gas usage.
- a short-term price-elasticity of minus 0.11, meaning that a 50-percent hike in the price of gas brings about only a 4- or 5-percent immediate drop in use (see blue curve in the graph above).
- a combined short- and long-term price-elasticity of minus 0.30, meaning that a sustained 50-percent rise in the price of gas causes usage over the long haul to be 11- or 12-percent less than it would be, otherwise (red curve).
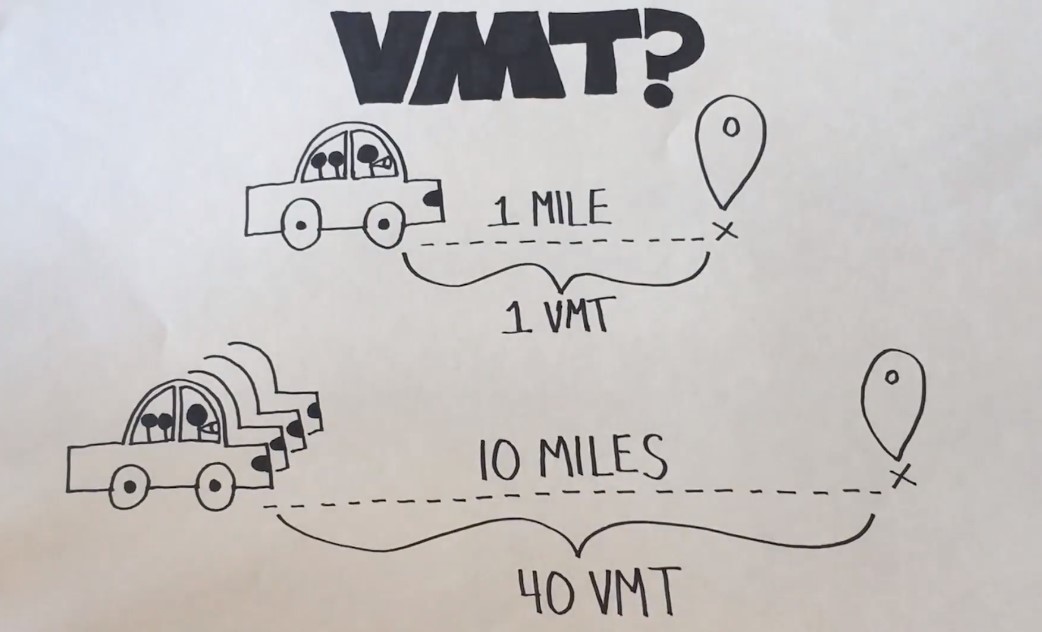
(My three variables, along with two “dummy” variables isolating the pandemic years 2020 and 2021, together explain almost 80 percent of the year-to-year changes in gasoline use over the 62-year period I studied. My splitting long-term changes in gas usage roughly equally between vehicle mpg changes and VMT changes is based on modeling by the renowned University of California transportation economist Ken Small.)
The amount that Americans drive, then, is fairly sticky — inelastic — with respect to the price of gasoline. Why is that? The obvious reason is an absence of convenient and reliable alternatives: trains, buses, safe cycle routes. Overlapping with these is automobile-reliant land use, including NIMBY-enforced zoning that keeps homes in denser, transit-friendlier areas out of reach for most.
Hand-in-hand with the above is the pervasive subsidization of driving through nearly ubiquitous free parking and unpriced congestion as well as the failure to price motor fuels’ toxic and climate pollution into their price.
Readers of this blog know all this. My purpose here is to deflate wishful thinking that so-called market increases in gasoline prices by themselves will bring about the reduced driving we long for.
No, that requires policy changes, which in turn require organizing: Demanding practical transit and safe bicycling networks. Bringing congestion pricing into being in New York. Building on that example with per-minute pricing for regulated fleets. Adapting and extending those models nationwide.
Speaking of congestion pricing: the stickiness of driving in the face of even sustained increases in the price of gas at least means that traffic congestion — the ultimate raison d’être of New York City’s congestion pricing plan — will still be with us during the countdown to the toll scheme. Indeed, thanks to the rebound effect, any gas-price-induced drop in driving into the Manhattan congestion zone will be partly negated by new car trips attracted to the slightly less-congested streets.
The takeaways: Only a stiff congestion price can meaningfully cut traffic congestion. And only organizing can bend those depressing price-usage curves or, better, make them irrelevant.
Charles Komanoff is the leading expert on congestion pricing modeling and carbon taxation and also an occasional consultant to the taxi industry. He is a regular Streetsblog contributor.
