Another Study Reaffirms That Speed Cameras Save Lives

Earlier this week while deconstructing the right-wing Illinois Policy Institute’s article about Chicago’s new 6 mph speed camera ticketing threshold, which contained lots of misleading statements and misinformation, I noted that IPI emphasized the speed cam program’s revenue generation and downplayed its safety benefits. As evidence of the latter, I cited Chicago Department of Transportation data I received from CDOT in early March 2021, when the city began issuing tickets for 6+ mph violations.
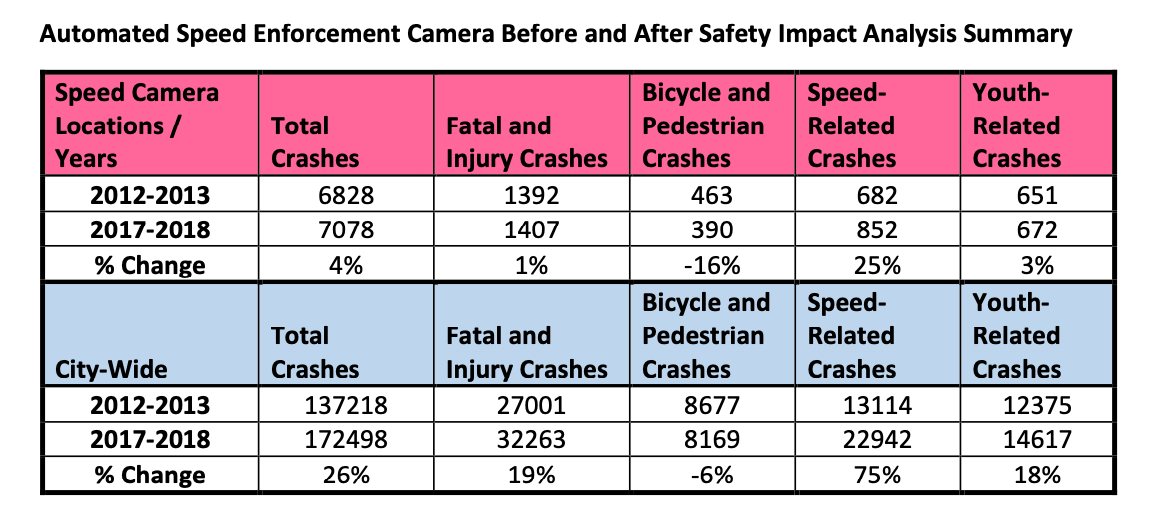
That CDOT study compared citywide crash data between 2012-13 and 2017-18. Serious or fatal injury crashes spiked by 19 percent across Chicago between those two periods, possibly due in part to more driving as ride-hail services became more popular. However, during that time serious and fatal collisions only increased by 1 percent in speed camera zones. In addition, while speed-related crashes rose by 75 percent across Chicago during that period, in speed cam locations, these kinds of collision only rose by 25 percent.
Thanks to a heads-up from a Streetsblog reader, I’ve since learned about a more recent analysis of the speed camera program the transportation department conducted, in compliance with a requirement in the state legislation that enabled the program. The new study compares the 2012-2013 crash data with 2018-2019 collision numbers.
The new study
As of January 1, 2021 Chicago had 162 speed cameras, one more than a year before that, deployed at 69 Child Safety Zones (areas within one-eighth of a mile of a park or school, the only locations where state law permits the cams), one more than the previous year, according to CDOT. 96 of the cameras enforce speed in one direction of travel, and 66 cams enforce speed in both directions. 85 cameras were installed at 40 park zones, and 77 cameras were deployed at 29 school zones.
For CDOT’s analysis, two single-direction cameras located close to each other (generally, opposite one another on either side of a roadway) were analyzed as a single location for consistency, the department said. A total of 106 locations, where a total of 149 speed cams were installed, were analyzed using crash data from the Illinois Department of Transportation. Twelve cameras that were activated in 2018 weren’t part of this analysis, because the city doesn’t yet have two full years of before and after data.
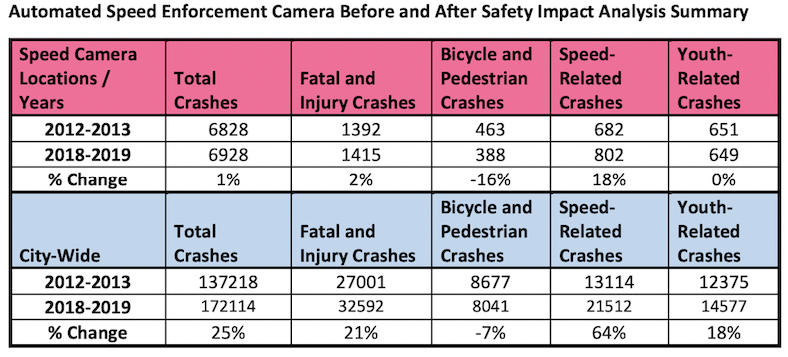
The study’s goal was to learn how traffic safety has changed in the areas around the speed cameras, comparing the numbers of crashes before and after camera installation, according to CDOT. Collisions within an eighth of a mile of camera locations were counted for two, two-year periods. 2012-2013 represents the period “before” installation of the cameras, and 2018-2019 represents the period “after” deployment. These two periods were then compared to each other, and then to citywide crash stats for those periods.
The Results
Between 2012-2013 and 2018-2019, the number of crashes for all crash types considered in this analysis – except bike and pedestrian – increased, both citywide and at speed camera locations, according to the department. However, the increases at cam locations were significantly lower than those experienced throughout the city as a whole. “This fact attests to the effectiveness of the cameras,” CDOT said. Some takeaways:
- Fatal or serious injury crashes increased only 2 percent near speed cameras between 2012-13 and 2018-19, as compared to a 21 percent increase citywide. This is similar to the 1 percent and 19 percent findings of last year’s study, which compared 2012-13 with 2017-18.
- Between 2012-13 and 2018-19, overall crash totals increased 1 percent in the cam locations, compared to a 25 percent increase in all crashes citywide. The figures from last year’s study were 4 percent and 26 percent.
- Speed-related crashes increased 18 near speed cams between 2012-13 and 2018-19, compared to a 64 percent spike city-wide. Those are smaller increases than were seen in last year’s study: 25 percent and 75 percent.
So overall the comparison of the 2012-13 data with the 2017-18 data in last year’s report, and with 2018-19 findings in this year’s study, found similar trends: The cameras are doing their job by keeping serious and fatal crash numbers in the safety zones relatively low compared those in other parts of the city, preventing life-changing injuries and deaths.
Read more details on the new CDOT study here.
The Streetsblog reader brought up another good point about the 6 mph threshold that I forgot to mention in my last article on the subject. Before the speed cameras began issuing tickets for 6-9 mph violations on March 1 of last year, there was a pilot period between January 15 and March 1 when the cams were photographing 6-9 mph speeders, but the violators were only issued warning notices.
The Illinois Policy Institute article quoted an editor named Vanessa Ortiz saying she didn’t realize she’d been caught speeding under the 6 mph rule until she’d already racked up eleven tickets. That’s even more inexplicable when you realize that she’d had a month and a half grace period to learn about the new policy.

Streetsblog has migrated to a new comment system. New commenters can register directly in the comments section of any article. Returning commenters: your previous comments and display name have been preserved, but you'll need to reclaim your account by clicking "Forgot your password?" on the sign-in form, entering your email, and following the verification link to set a new password — this is required because passwords could not be carried over during the migration. For questions, contact tips@streetsblog.org.