
San Francisco and Berkeley are the only two California cities that made it onto AARP's list of the nation's top ten “most livable” cities—San Francisco for large cities, Berkeley for medium-sized ones. While personal definitions of what makes a city “livable” may vary, the AARP's “Livability Index” joins many data points into a single number that says something, more or less, about how easy it is to get by in a particular place.
It's maybe not so surprising that San Francisco and Berkeley are high on the list, which measures access to housing and transportation, among other things. But the two cities are also some of the most expensive places in the nation to live, especially in terms of housing—which says a lot about the economic value of livability. But it also reflects a quirk of the Livability Index, which gives a high value to policies that may or may not be felt on the ground yet.
AARP California’s State Director Nancy McPherson says that policies are important to include in the index, in addition to data points, because “the policies you have in place will affect your communities, so they should affect the score. Otherwise, you're relying on elected leaders and any progress made may not last beyond the current administration.”
The high ranking of San Francisco and Berkeley also reflects the holistic nature of the index, which incorporates a wide range of metrics, including physical ease of access to household needs and the availability of multi-family and subsidized housing in addition to how much housing costs and what percent of their income residents pay for housing (in both cities, that comes to about 22 percent of income, compared to a nationwide average of 18 percent.)
Berkeley and San Francisco both score high on the transportation metric, which is measured in terms of transit frequency, average number of walk trips (1.7 per household in San Francisco and 1.4 in Berkeley, compared to the national average of 0.73 per household per day); accessible stations and vehicles, average speed limits, and crash rates (for San Francisco, 3.8 fatal crashes annually per 100,000 people; in Berkeley, 4.4—compared to the national average of 6.8).
The transportation metric does not neglect congestion, which it measures based on how many hours per year residents spend stuck in traffic (in both cities, the numbers is 42 hours, compared to a nationwide average of 25.4 hours). That sounds bad—and it's not great, because congestion slows travel and increases pollution—but it is also a reflection of economic success. In addition, one of the reasons the Bay Area has the transit options it does have is because congestion is bad enough that people recognize it is vital and have repeatedly voted in favor of taxing themselves to help fund it. And although plenty of people drive cars and spend hours in traffic, a lot of Berkeley and San Francisco residents take transit.
It's harder to argue for frequent, high-quality transit in areas where many people are willing to drive long distances, even though not having the transit access lowers the quality of living, especially for people who can't or don't want to drive.
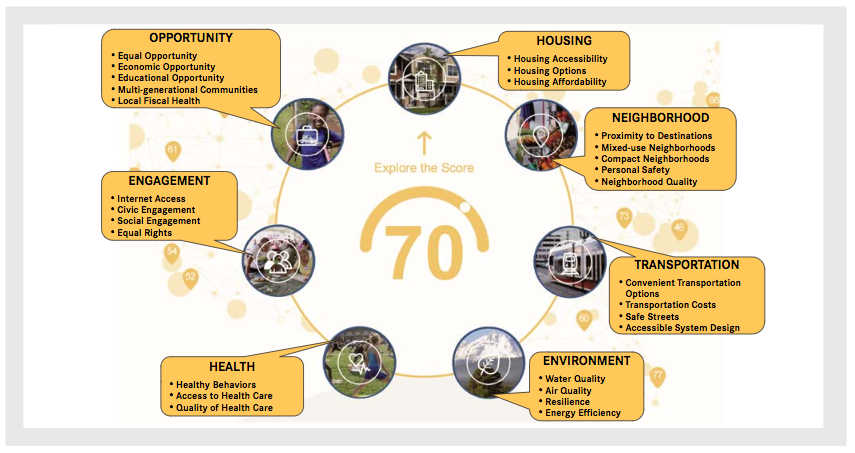
AARP first launched its Livability Index in 2015. Today it released an update with new metrics, including more detailed data about various criteria that help define an area's livability. In addition to housing and transportation, those include the quality of the environment, access to health care and open spaces, community engagement, and economic opportunity. The index compares hundreds of cities nationwide, compiling statistics that can give residents and officials a sense of how well they're doing in comparison to other cities—and how much work there is left to do.
It's a lot of fun to poke around in. You can compare different cities and dive in deep to see what policies and scores your city earns. But it's not just for fun. The information can be used by local residents and public policy decision-makers to better understand their communities. “It can also encourage people to advocate for livability improvements in the areas that are important to them,” said McPherson.
She gave the example of the city of West Sacramento, which used its ranking on the index as a baseline when it joined AARP's Network of Age-Friendly Communities. As part of that network, she said, leaders commit to completing a community assessment, creating an action plan, and implementing changes over time to become more livable places.
Sacramento, according to the report accompanying today's update, used data from the Livability Index to help write the city's General Plan in 2016, in which they established a goal of becoming the “most livable city in the country by 2035.”
The report also highlights a “disturbing trend toward increasing sprawl” across the nation, despite individual community efforts to improve. The updated index shows that the number of people and jobs per square mile has declined over time, leading to less compact neighborhoods, and the variety of destinations in certain areas is also declining, which means people in those areas must travel further to fulfill various needs. Unfortunately, according to the Livability Index, “the vast majority of Americans continue to live in neighborhoods where it is largely impractical to walk to basic services.”
There is a lot more information available about the index from the report, as well as the AARP website.