Crowdsource Bicycling App ‘Ride Report’ Goes National Today
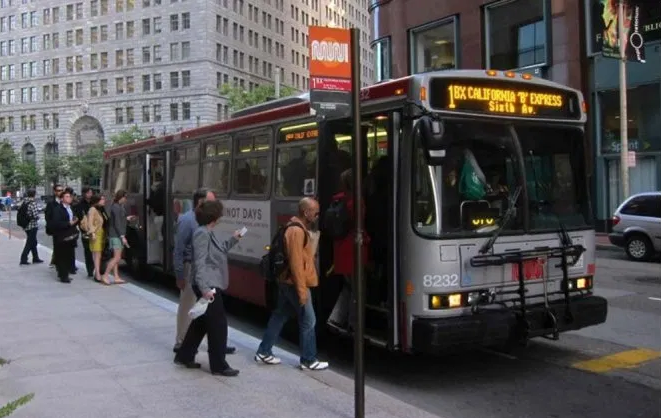
Since last September, Portland cyclists have been generating bike trip data via the free Ride Report app. Today, Ride Report has completed its Portland beta and is now open for use throughout the United States.
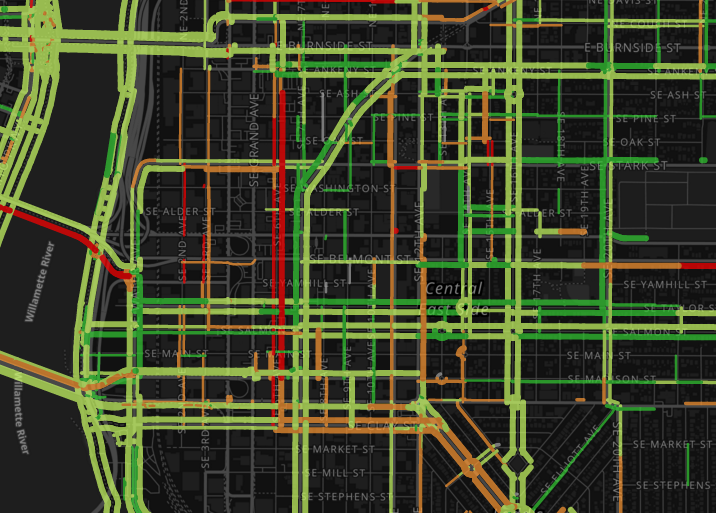
Ride Report, currently available for iPhone only (Android coming soon), runs in the background. The app knows when riders are riding their bikes, and tracks these trips. After each trip it prompts a short one-question survey: was the last trip "stressful" or "chill"? The app aggregates survey data to form a crowdsourced bicycling map showing which routes cyclists rate best and worst. End users--likely to be mostly folks who are already regular riders, according to Ride Report co-founder William Henderson--can track their trips and can view crowdsourced maps. Ride Report also works with municipalities to license data for bicycle planning. Much of the data is available free in an open source format; for full data, cities contract with Ride Report.
BikePortland's Michael Andersen writes that Ride Report is "simple, seamless, and some of the messages are gently funny, which makes it a pleasure to use." Andersen's recent article reviewed Ride Report data maps for Portland, identifying which streets are stressful at which times of day.
There are a few apps that are helping cities better understand cycling patterns. For example, Strava has licensed its trip data to cities. With its trip evaluation tool, Ride Report builds in the additional data layer of the bicyclist experience.
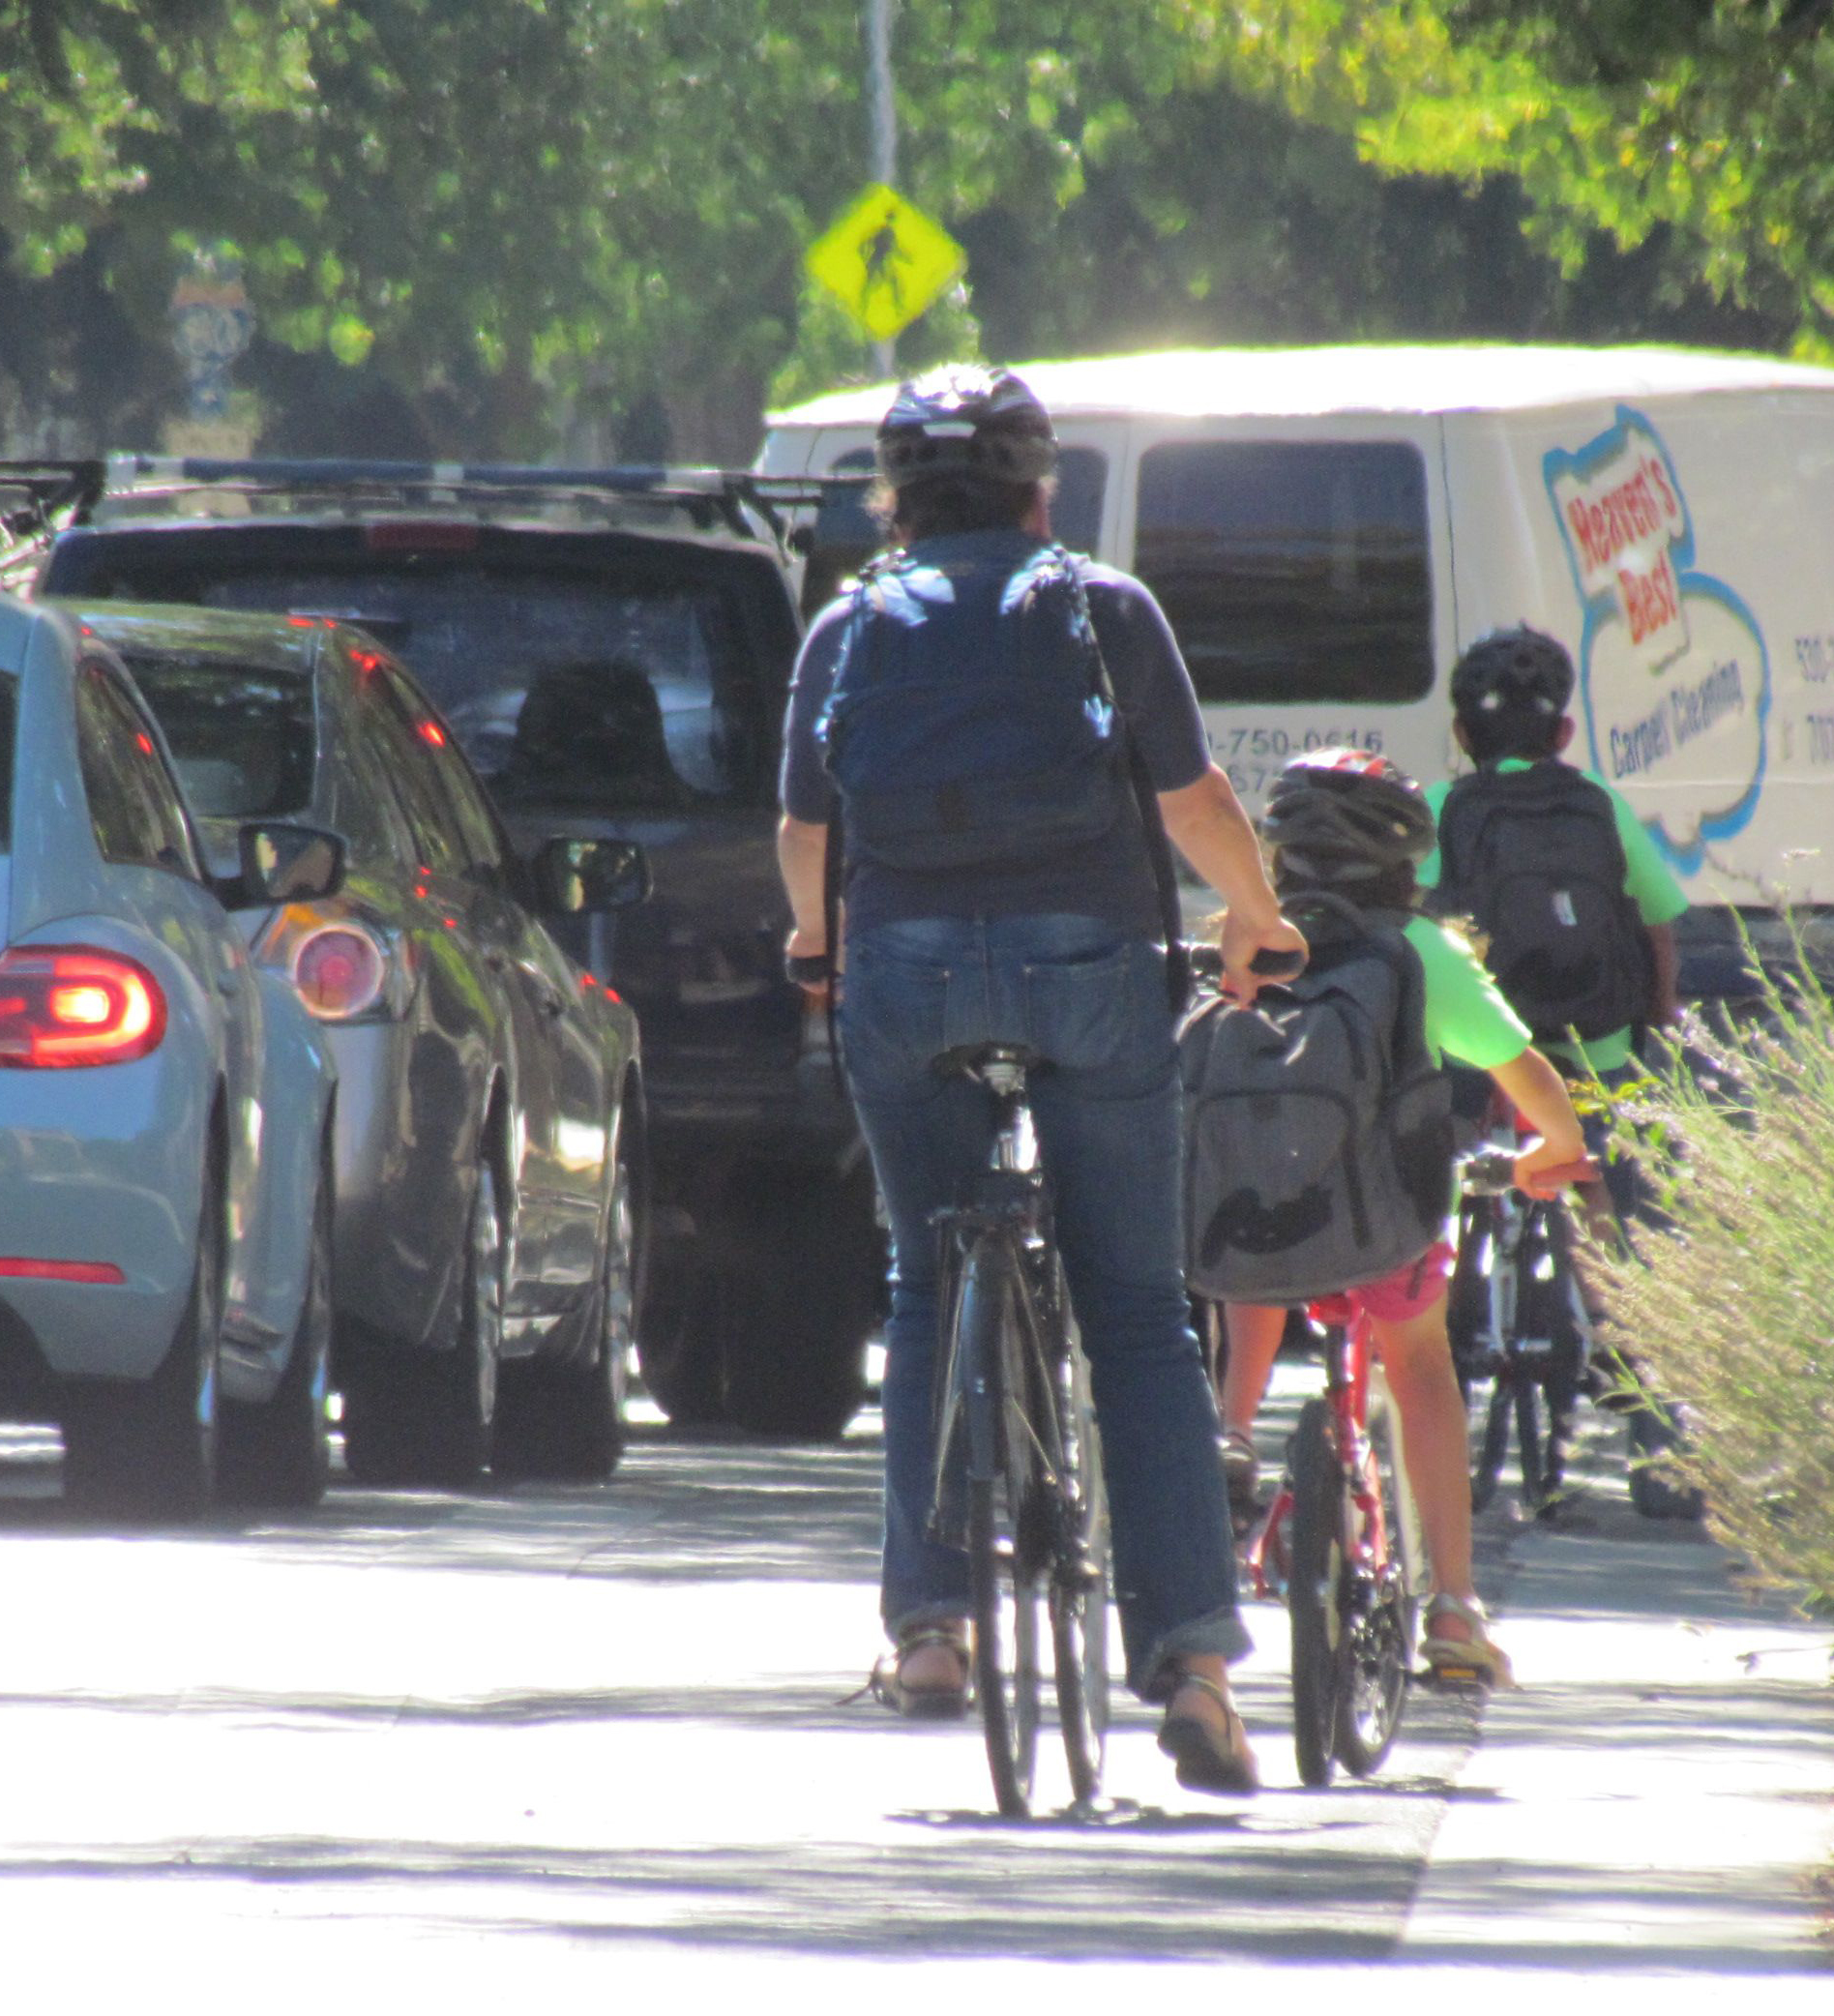
These apps are still in their early stages; none are perfect. They, of course, only track the trips of people who are well enough off to own a smart phone, hence low income riders and low income neighborhoods are very likely underrepresented in their data. Andersen mentions that during the past week Ride Report "accounted for 7% of my battery power. It turns off automatically when I'm under 20%, which is nice."
Cyclists - are you using Ride Report and/or other apps to track your trips? What do you like or dislike about the app? What additional features could make your trips, your neighborhoods, and your region better?
Read More:
Stay in touch
Sign up for our free newsletter
More from Streetsblog California
Active Transportation Program Calls for Volunteer Evaluators
Apply to be a volunteer ATP application evaluator by May 10.
Study: When Speed Limits Rise on Interstates, So Do Crash Hot Spots on Nearby Roads
Rising interstate speeds don't just make roads deadlier for people who drive on them — and local decision makers need to be prepared.

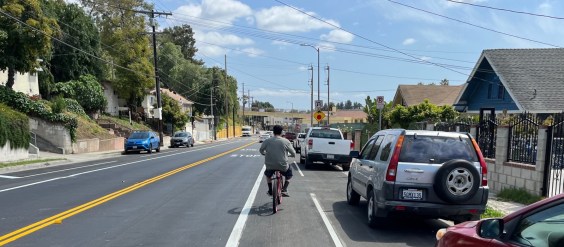
Eyes on the Street: New Lincoln Park Avenue Bike Lanes
The recently installed 1.25-mile long bikeway spans Lincoln Park Avenue, Flora Avenue, and Sierra Street - it's arguably the first new bike facility of the Measure HLA era
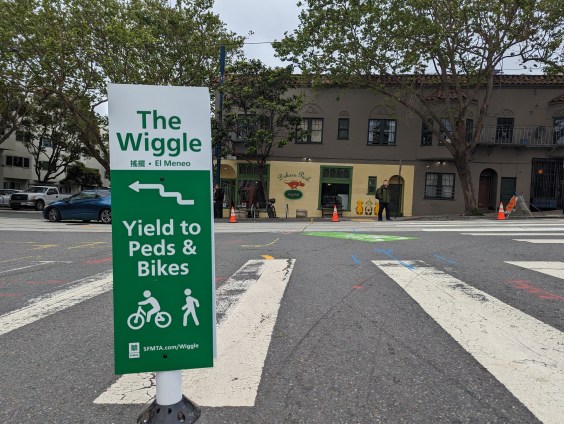
Independent Safety Advocates Beef up the Wiggle
Signs and soft-hit posts installed by advocates make the Wiggle bike route calmer and safer for cyclists and pedestrians
Thursday’s Headlines
LA Metro declares emergency over attacks on bus operators; Some deadly Bay Area streets to see safety fixes; Tax ride-hail to save transit? More