Crowdsource Bicycling App ‘Ride Report’ Goes National Today
Since last September, Portland cyclists have been generating bike trip data via the free Ride Report app. Today, Ride Report has completed its Portland beta and is now open for use throughout the United States.
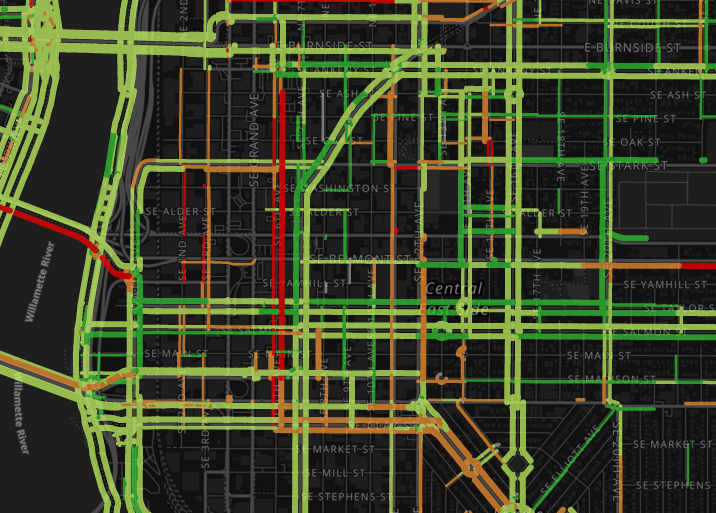
Ride Report, currently available for iPhone only (Android coming soon), runs in the background. The app knows when riders are riding their bikes, and tracks these trips. After each trip it prompts a short one-question survey: was the last trip “stressful” or “chill”? The app aggregates survey data to form a crowdsourced bicycling map showing which routes cyclists rate best and worst. End users–likely to be mostly folks who are already regular riders, according to Ride Report co-founder William Henderson–can track their trips and can view crowdsourced maps. Ride Report also works with municipalities to license data for bicycle planning. Much of the data is available free in an open source format; for full data, cities contract with Ride Report.
BikePortland’s Michael Andersen writes that Ride Report is “simple, seamless, and some of the messages are gently funny, which makes it a pleasure to use.” Andersen’s recent article reviewed Ride Report data maps for Portland, identifying which streets are stressful at which times of day.
There are a few apps that are helping cities better understand cycling patterns. For example, Strava has licensed its trip data to cities. With its trip evaluation tool, Ride Report builds in the additional data layer of the bicyclist experience.
These apps are still in their early stages; none are perfect. They, of course, only track the trips of people who are well enough off to own a smart phone, hence low income riders and low income neighborhoods are very likely underrepresented in their data. Andersen mentions that during the past week Ride Report “accounted for 7% of my battery power. It turns off automatically when I’m under 20%, which is nice.”
Cyclists – are you using Ride Report and/or other apps to track your trips? What do you like or dislike about the app? What additional features could make your trips, your neighborhoods, and your region better?

Streetsblog has migrated to a new comment system. New commenters can register directly in the comments section of any article. Returning commenters: your previous comments and display name have been preserved, but you'll need to reclaim your account by clicking "Forgot your password?" on the sign-in form, entering your email, and following the verification link to set a new password — this is required because passwords could not be carried over during the migration. For questions, contact tips@streetsblog.org.