New Website Quantifies Benefits of California Climate Change Policies
Each time California legislators consider its climate change policies, questions arise about what benefits the state is receiving for its current investments. Until today, there has been no centralized source of data on the state’s investments from its cap-and-trade program nor on resulting greenhouse gas emissions or other benefits.
Now there is. TransForm, a nonprofit that advocates for rational transportation and land use policies, just unveiled a searchable online map to track investments from California’s cap-and-trade program. The Climate Benefits Map, currently in beta form, will eventually collect all the data available about the various programs and projects funded by the Greenhouse Gas Reduction Fund (GGRF) and make it available for the public to peruse.
TransForm’s aim is to highlight the benefits of California’s climate change policies, including environmental, economic, and community benefits. With this map they have begun the process of quantifying those benefits in consistent terms across various programs funded by the GGRF. “We really believe that California is benefiting from its climate change policies,” said Shannon Tracey, TransForm’s communications director, and they want to make that information public. “With legislation like S.B. 32 and S.B. 350 advancing” in the legislature, “it’s important for people to see what we’re getting from these investments.”
The data will be available to guide future decisions about climate change legislation, as well as ongoing discussions of investment plans. “This tool will help people evaluate whether we’re doing the right kinds of investments,” said Tracey.
It might also serve to light a fire under the California Air Resources Board, which is developing its own online tracking tool for climate change policies but is not anywhere close to having it available for use.
California’s GGRF currently funds a wide range of programs, administered by different state agencies:
- Affordable Housing and Sustainable Communities Program (AHSC), administering agency: Strategic Growth Council
- Sustainable Agriculture Land Conservation Program, administering agency: Strategic Growth Council
- Low-Carbon Transit Operations Program, administering agency: Caltrans
- Transit and Intercity Rail Capital Program, administering agency: California State Transportation Agency
- Low-Carbon Transportation, administering agency: California Air Resources Board
- High Speed Rail, administering agency: High Speed Rail Authority
- Low-Income Weatherization Program, administering agency: Department of Community Services and Development
- Energy Efficiency in Public Buildings, administering agency: California Energy Commission
- Agricultural Energy and Operational Efficiency, administering agency: Department of Food and Agriculture
- Water-Energy Efficiency, administering agency: Department of Water Resources
- Wetlands and Watershed Restoration, administering agency: Department of Fish and Wildlife
- Urban Forestry, Forest Health Restoration, and Reforestation, administering agency: Cal Fire
- Waste Diversion, administering agency: CalRecycle
Some of these programs have been allocated a percentage of cap-and-trade revenues, totaling sixty percent of auction proceeds: AHSC (twenty percent), low-carbon transit operations (five percent), transit and intercity rail (ten percent), and high-speed rail (25 percent). The other forty percent is not specifically allocated to any program by statute.
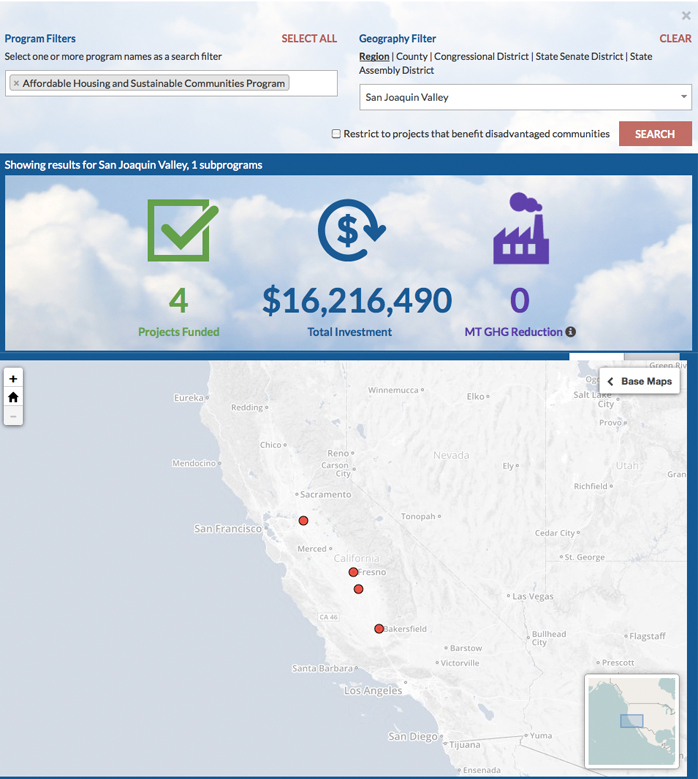
TransForm’s online map shows projects that have been funded so far, and includes data such as projected reductions in greenhouse gas emissions and vehicle miles traveled for each project. Users can search by program, by keyword, and by location. So, for example, one can look for all of the projects in a particular legislative district, or search for a specific program within a given county or region. Each dot on the map represents a project, and a popup window contains summary information including the project name, a map of the area it affects, and how much money it was awarded under which program. Detailed information displays when a specific site is selected, including a project description and photos relating to the project.
The website shows that 204 projects have been funded so far with over $400 million from the GGRF, with a projected reduction of almost 9 million tonnes of greenhouse gas emissions–but Tracey warns the GHG numbers are lower than what they ultimately will show. “There has been some delay between the announcements of awards and the release of project details,” she said.
At the moment there are many gaps in the data. This is partly because the funding programs are new, and some agencies are still figuring out what information they need to gather and how to do it.
“We don’t have enough data yet to do additional quantifications,” said Ryan Wiggins, TransForm’s cap-and-trade campaign manager. “In some cases [the agencies] have been responsive; in other cases the data has been slow in coming, and it comes piecemeal. However, we definitely recognize that it’s not easy, and that it will take time.”
As the data becomes available, the team at TransForm will continue to fill in the gaps.
The site includes a detailed discussion of how the data was gathered, where gaps exist and why, and what TransForm and their partners did to make data consistent. Most of it comes straight from the state agencies that administer the programs. For example, all greenhouse gas reductions were calculated by the responsible agencies using ARB-defined quantification methods.
In some cases, data limitations will remain, and will hamper future evaluation of climate change policies. Many AHSC projects, for example, include some component of bicycle or pedestrian infrastructure. None of that information is available yet, but even when it does show up on the map it will be perfunctory. Because of the way the Strategic Growth Council is gathering data, there won’t be any more quantifiable information forthcoming beyond whether a project has a bicycle or pedestrian element.
The Air Resources Board (ARB) acknowledges that “there’s definitely a need to show the benefits that come from these projects,” according to Elizabeth Yura. She leads a team that is developing a website to collect climate change policy data and make it available to the public, but “it will be a few years before it’s ready.” That site will focus on data that agencies will be required to report, based on guidelines [PDF] currently in development.
ARB is seeking comment on those reporting guidelines. The deadline for submitting comments has been extended to August 14. ARB will also hold a workshop on those guidelines tomorrow, July 16, in L.A.
Kudos to TransForm for taking on this project. Despite current limitations, this site is more complete and easier to use than other sources. Maybe the efforts of this tiny nonprofit can set an example for state agencies working to better inform the public about greenhouse gas reduction efforts underway.

Streetsblog has migrated to a new comment system. New commenters can register directly in the comments section of any article. Returning commenters: your previous comments and display name have been preserved, but you'll need to reclaim your account by clicking "Forgot your password?" on the sign-in form, entering your email, and following the verification link to set a new password — this is required because passwords could not be carried over during the migration. For questions, contact tips@streetsblog.org.