New Website Puts Faces to Traffic Violence Numbers
Thirty fatalities a year in San Francisco. 600 or so with serious injuries. High injury corridors. An epidemic of speeding and reckless driving. Distracted driving. Blocked bike lanes. Traffic violence.
It’s clear that a good portion of the population of our cities don’t understand these numbers and terms and their implications. They don’t grasp the horrors bad street designs and policies cause for individuals and their loved ones. That’s why advocates Marcel Moran and Stephen Braitsch built Transpo Maps, a new website that connects all that data and terminology to real people who have been hurt and killed.
“My goal with this project is to raise awareness about this ongoing public health crisis that the city can’t seem to meaningfully address,” wrote Braitsch in an email to Streetsblog. “These were people who had friends and families, they’re not just data points on a map or chart.”
Here’s how it works. Open up the “Traffic Fatalities Citywide” section of the page. Run the cursor over any of the dots indicated on the map and a sidebar will open showing who was killed, how it happened, and a little bit about the person.
Of course, nearly all of these deaths were entirely preventable.
And yet one continues to hear politicians and others argue that somehow there’s something to compromise about when it comes to always-convenient parking and high-speed driving versus the lives and broken bones of human beings.
- Raise awareness of the ongoing violence cars unleash on our streets. According to data from the Department of Public Health, San Francisco has lost someone to car violence an average of every 13 days since Vision Zero was adopted in 2014. A driver hits another human being, on average, every four hours. That’s six times a day, every single day.
- Humanize this data. These were people, who had lives and families, they’re not just data points on a map or chart. I’ve spent hundreds of hours pouring through news articles dating back to 2005 trying to identify the victims. So far I’ve identified 138 of the 244 in our database. My hope is that this project can help us crowd-source information about the rest. Once we’re able to identify ~80-90 percent of the victims, I plan on releasing a detailed demographic study on the victims that looks at age, gender, race and neighborhood to understand if certain communities are disproportionately impacted by traffic violence over others and what we can do to address that.
- Hold our elected officials accountable for these preventable deaths. The analysis I wrote breaks down crashes by supervisor district and my next step is to go through the social media accounts of every member of the Board of Supervisors and catalog what they said (or didn’t say) when a fatality occurred in their district. I also plan on getting SFMTA records to evaluate their “rapid-response” to each fatality and what they did to make the crash site safer. I think that will be very powerful to share when SFMTA gives their next annual Vision Zero update.
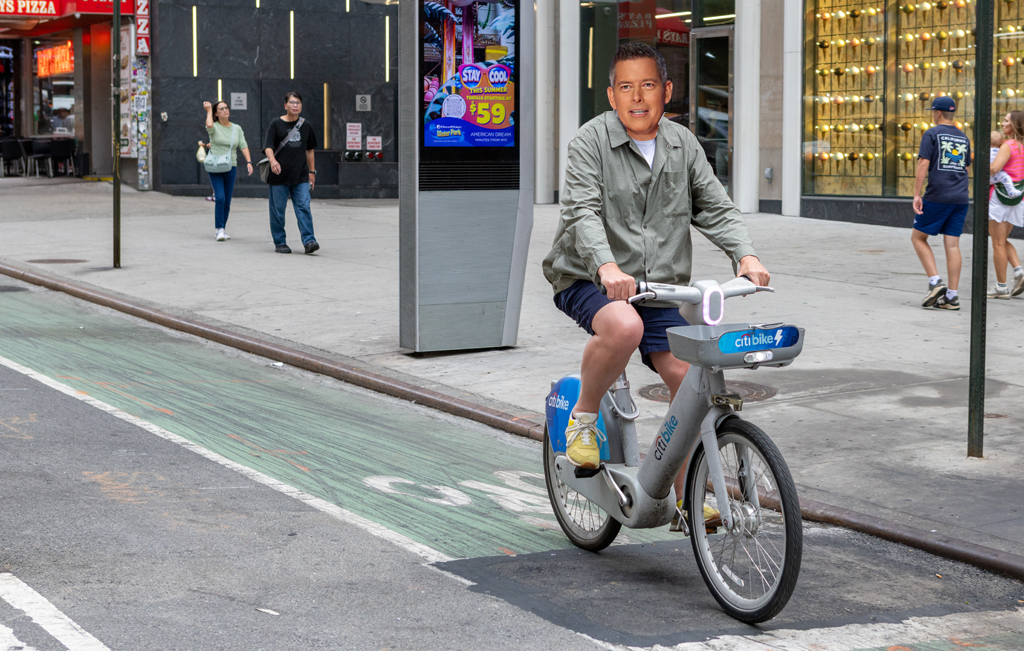
A protected bike lane we can believe in https://t.co/O4pQVO5FWJ
— Bike New York (@bikenewyork) March 25, 2022
Perhaps the page will provide city planners and politicians with some moral clarity about the evil–and it is evil–in prioritizing motorist convenience over human life. New York City has finally seen the light and is slowly protecting bike lanes and pedestrians with concrete, as seen in the tweet above. That’s how cities can keep people safe from errant motorists.
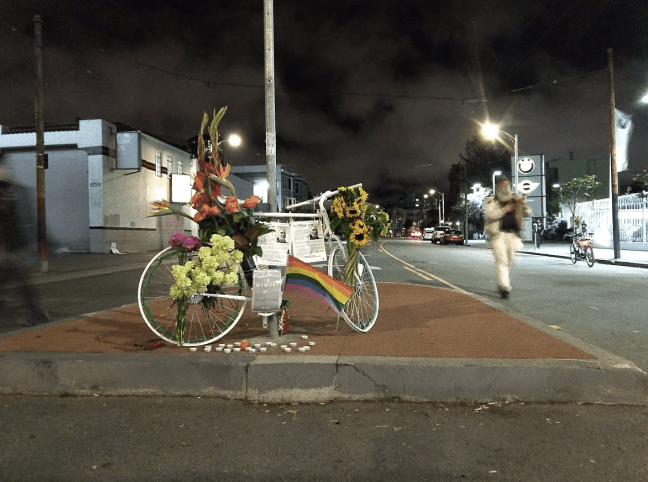
Streetsblog is already finding the site to be a useful tool in tracking information on the carnage that continues to plague our streets. Be sure to check it out. And consider riding in one of this week’s “Ride of Silence” rides to pay respects to cyclists killed thanks to bad policies and messed-up priorities in our city.

Streetsblog has migrated to a new comment system. New commenters can register directly in the comments section of any article. Returning commenters: your previous comments and display name have been preserved, but you'll need to reclaim your account by clicking "Forgot your password?" on the sign-in form, entering your email, and following the verification link to set a new password — this is required because passwords could not be carried over during the migration. For questions, contact tips@streetsblog.org.