STUDY: How Race and Income Impact Road Safety in Oregon

Editor’s note: This article originally appeared on Bike Portland. It is republished here with permission.
A growing body of research has proven that incomplete and dangerous transportation infrastructure in lower-income areas has a disparate negative impact on Black, Indigenous and people of color. Now ODOT’s own analysis proves the existence of these impacts on BIPOC Oregonians for the first time.
The Oregon Department of Transportation has released a groundbreaking new technical memo titled Pedestrian Injury and Social Equity that draws a line between injury and fatality rates of non-drivers and the racial, income and geographic makeup of crash victims.
“It’s important to recognize these disparities and understand the underlying conditions that create them so that targeted and effective action can be taken,” reads the opening of the 18-page memo written by Josh Roll, an active transportation researcher at ODOT.
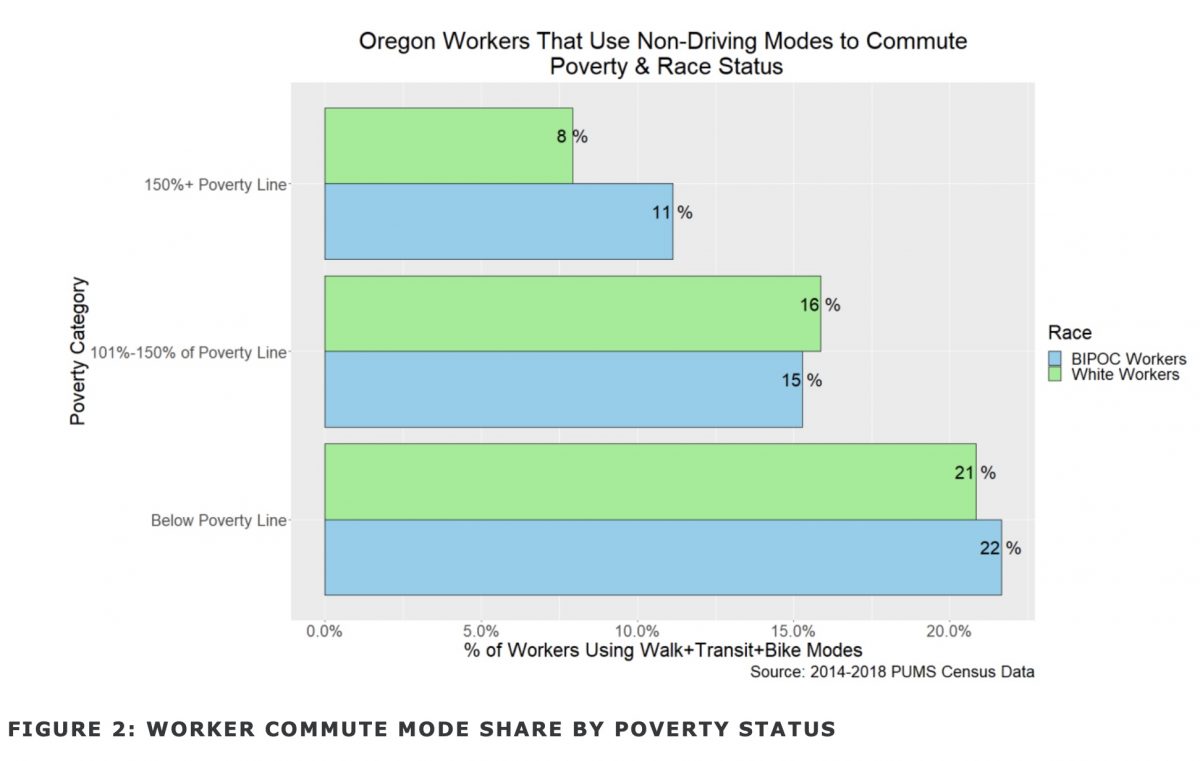
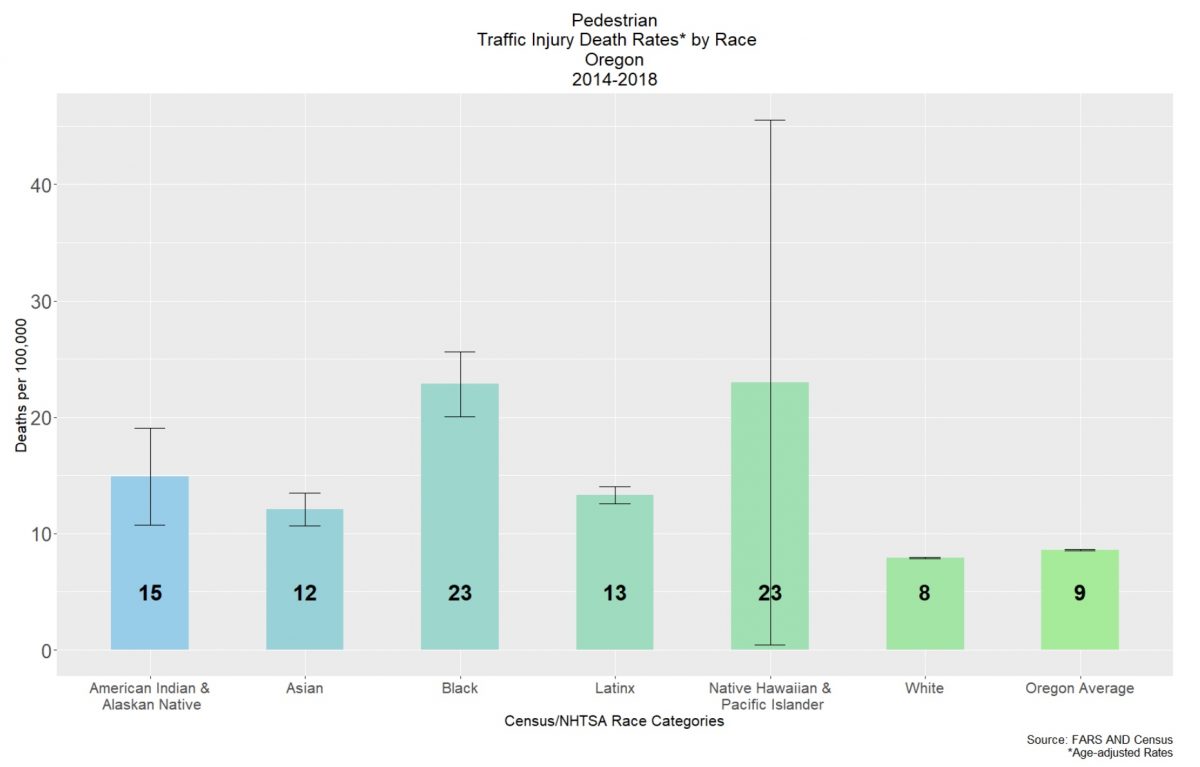
Selection of charts and data from the report. View more at Bike Portland.
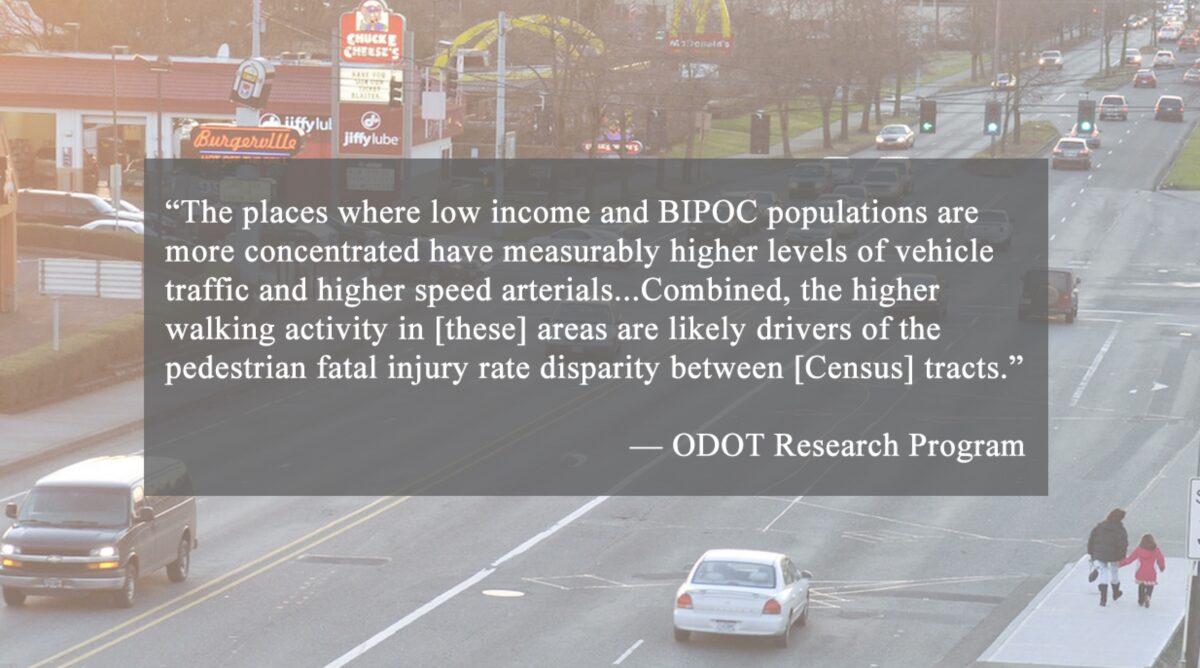
Roll and his team cross-referenced income, race, and crash data with Census tracts of Portland, Medford and Salem and found that places with a higher concentration of people of color and poverty are much more likely to suffer injury or death while walking.
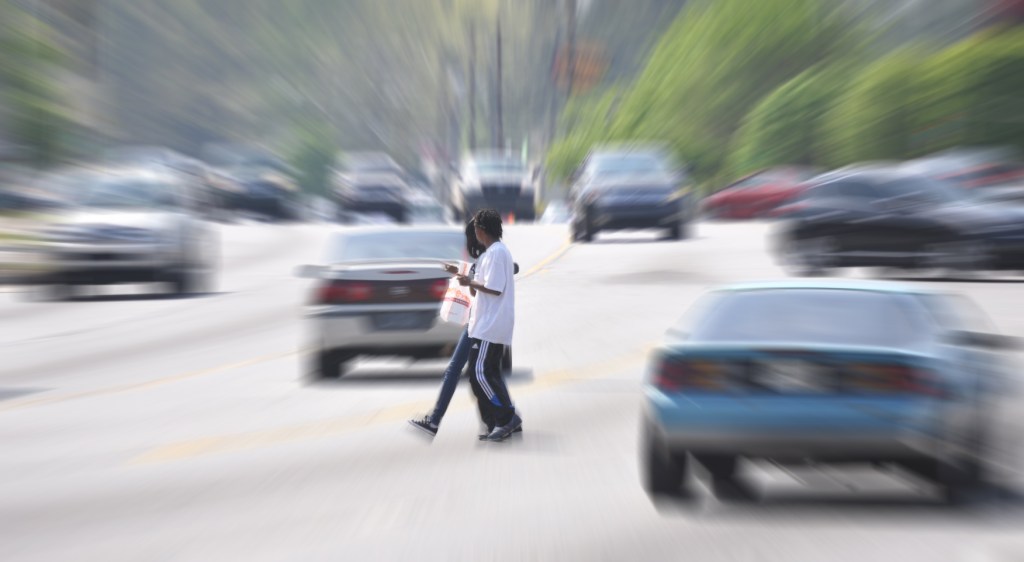
“People who are low income and/or BIPOC are more likely to walk and take transit [due to the high cost of auto ownership], meaning they have greater exposure as pedestrians to traffic safety risks,” states the report. “Further, they are more likely to walk in environments with higher vehicle traffic volumes, less street connectivity, and fewer pedestrian safety features like sidewalks and crossings. These factors combine to result in higher pedestrian fatal injury rates for these groups.”
It’s important to note that because income of crash victims isn’t included in federal or state data, ODOT did a separate analysis of neighborhood characteristics to quantify the role poverty plays. This “ecological analysis approach” is a limitation of the research.
While ODOT’s research finds a direct line between race, income, geography and crash data; they weren’t able to analyze how the lack (or presence) of certain types of safety infrastructure — like sidewalks and crossing treatments — impact injury and fatality rates. That’s because ODOT still has no comprehensive database to track this type of infrastructure statewide.
The study also took into account how a “segregated housing landscape contributes to different transportation experiences, travel options, and safety conditions.” “Land use and zoning policies, home lending practices, and housing affordability have all contributed to income and racial differences in housing locations,” the report states.
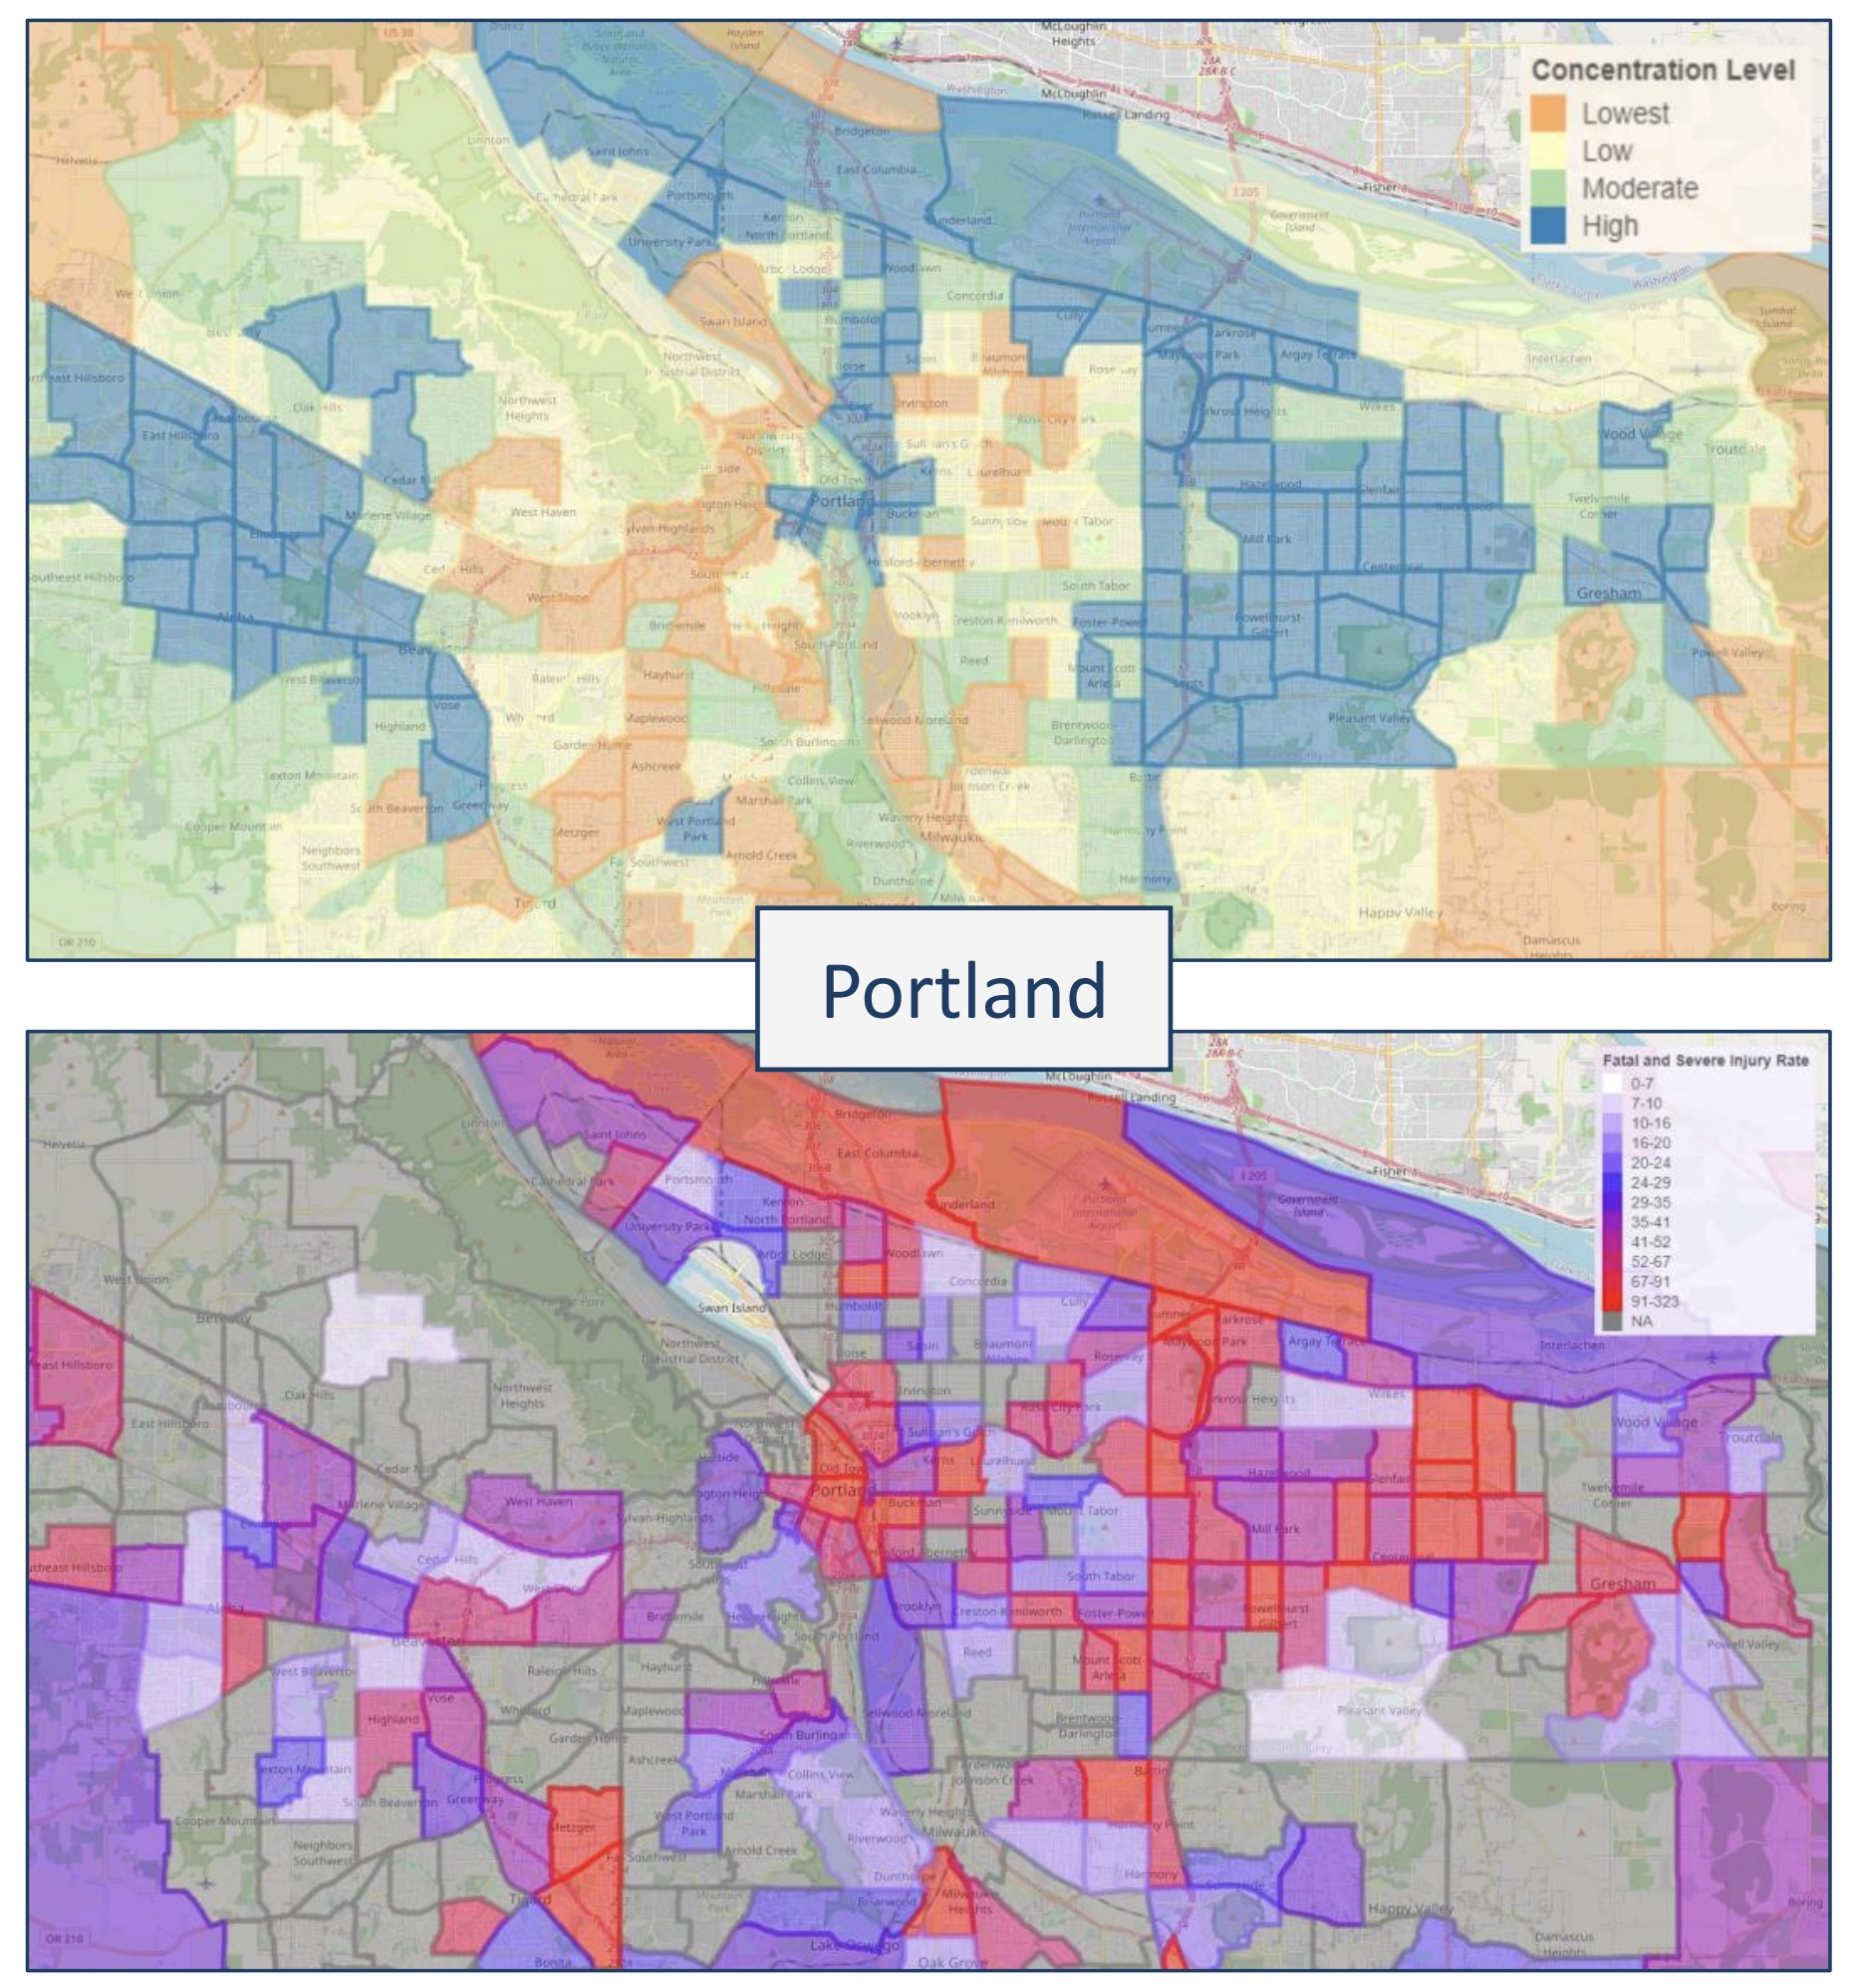
According to the research, about 24% of the total Oregon population live in a Census tract designated as having a high concentration of low income and BIPOC residents, but have about 40% of the total injuries. The fatal and severe injury rate for people walking in Census tracts classified as “high” in ODOT’s concentration index is over two times the rate in the lowest category and 63% higher than the statewide average.
A big reason for the higher impact on low-income and BIPOC residents is what ODOT refers to as a “harsh” transportation environment. “The average arterial vehicle miles travel (VMT) density in tracts classified as high is nearly three times higher than the lowest category and about 68% higher than the state average,” the report reads. “There are nearly twice as many high speed roadway miles per square mile compared to the lowest index category.”
Now that ODOT’s own data aligns with existing research, this information should be used to inform investment decisions. As mentioned above, it should also create urgency to develop a comprehensive statewide database of infrastructure like street lights, sidewalks and traffic calming features so those gaps can be filled as soon as possible.
ODOT’s findings come just weeks after Multnomah County released a report with similar findings.
Learn more by reading the full memo here (PDF).

Streetsblog has migrated to a new comment system. New commenters can register directly in the comments section of any article. Returning commenters: your previous comments and display name have been preserved, but you'll need to reclaim your account by clicking "Forgot your password?" on the sign-in form, entering your email, and following the verification link to set a new password — this is required because passwords could not be carried over during the migration. For questions, contact tips@streetsblog.org.