Uber and Lyft have finally come clean: Their vehicles are causing a big share of the congestion in several American cities.
A new study jointly commissioned by the two app-based cab companies found that they have a massive footprint in San Francisco, Washington and Boston, but the companies are affecting traffic to a lesser degree in Chicago, Seattle, and Los Angeles, where private car ownership is much higher.
Both companies have experienced explosive growth in the past decade but haven't acknowledged how much congestion they've caused in America's cities — until now.
Transportation consultants Fehr & Peers compared miles traveled for ride share companies as well as private and commercial vehicles in six cities over the course of one month: September 2018. The analysis is a "high-level exercise" that help both companies understand how they contribute to congestion and "help them form appropriate narratives for both internal and external communication," the study noted.
In other words, admit their role in jamming traffic in cities, conveniently blame household car ownership and commercial trucking for clogging most roadways, and eventually pivot to advocate for congestion pricing in other cities.
"At Uber, we’re focused on reducing the need for private car ownership while expanding transportation access for all," the company's Head of Global Policy for Public Transportation Chris Pangilinan wrote in a Medium post that accompanied the study. "As we continue to grow in the communities we serve, it’s important to understand how roads are being used so we can continue to work together with cities to develop the right policies that expand mobility.
Uber and Lyft are largely correct that private cars and commercial trucks, buses, and vans made up the vast majority of vehicle miles traveled in major metro areas where they have a presence. Ride share companies accounted for only one to three percent of traffic — the rest of the VMTs were made by private car drivers — but the results varied far more dramatically in each area's urban core:
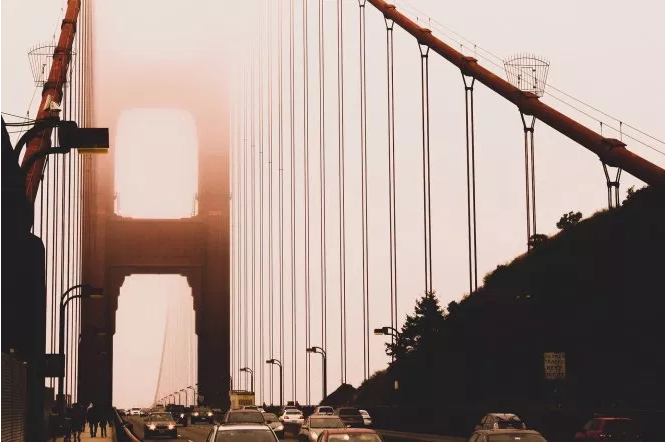
- In San Francisco, 12.8 percent of total vehicle miles traveled were made in an Uber or Lyft.
- In Boston, it was 7.7 percent.
- In Washington, 6.9 percent.
- In Chicago, 3.3 percent.
- In L.A., 2.6 percent
- In Seattle, 1.9 percent.
San Francisco, Boston, and Washington had a larger share of ride share vehicles than the other cities because they are "denser and more compact and contain less suburban, rural, and exurban land area," the study said.
New York was not included in the six-city study because its transit system is so much larger than other cities in the rest of the country and car ownership remains comparatively low. Other studies have shown the crippling effects of ride share vehicles on Manhattan traffic -- which led the New York State Legislature to adopt a congestion pricing surcharge on vehicles entering Manhattan's central business district earlier this year.
But the study leaves out a lot of information, too. It doesn't address Uber and Lyft's effects on traffic over time or how many trips ride share companies take from public transit.
And while both companies have zealously guarded their ridership data, other traffic analysts have sought to provide a clearer view of their influence.
For instance, Schaller Consulting found in 2018 that private ride share vehicles accounted for a 180-percent increase in driving on city streets and that 60 percent of ride share users would have taken public transit or walked or biked if the vehicles weren't available to them. And another independent study earlier this year found that ride hail companies made up more than half of San Francisco's 62-percent jump in weekday traffic delays between 2010 and 2016.
CityLab reported that the companies, which have since gone public this spring, are being more transparent because they are looking to shape the public debate over congestion pricing. That could lead to more people choosing Uber and Lyft rides instead of commuting to work or driving into the city for a concert or a game in their own vehicles.
Uber and Lyft's strategy for the future will be to acknowledge a role in creating more traffic in downtown areas, with plenty of supporting evidence, while vociferously blaming congestion on commercial trucks and families who choose to drive their own car over taking transit.
"The research shows that despite tremendous growth over the past decade, [Uber and Lyft] use still pales in comparison to all other traffic, and although [Uber and Lyft] are likely contributing to an increase in congestion, its scale is dwarfed by that of private cars and commercial traffic," Pangilinan wrote in his Medium post.
