Data Confirms Uber and Lyft Jam up San Francisco
Note: GJEL Accident Attorneys regularly sponsors coverage on Streetsblog San Francisco and Streetsblog California. Unless noted in the story, GJEL Accident Attorneys is not consulted for the content or editorial direction of the sponsored content.
Transportation Network Companies such as Uber and Lyft accounted for roughly half of the increase in congestion in San Francisco between 2010 and 2016, as measured in vehicle hours of delay, vehicle miles traveled, and average speeds. That was the takeaway from “TNCs Today: A Profile of San Francisco Transportation Network Company Activity,” a new report from the San Francisco County Transportation Authority.
The study found that TNCs have caused a bigger headache on San Francisco streets than population and job growth combined, as shown by the charts below:
Other findings include:
- TNCs drive approximately 570,000 vehicle miles within San Francisco on a typical weekday. This accounts for twenty percent of all local daily vehicle miles traveled (VMT) and includes both in-service and out-of-service mileage.
- On an average weekday, more than 5,700 TNC vehicles operate on San Francisco streets during the peak period. On Fridays, over 6,500 TNC vehicles are on the street at the peak.
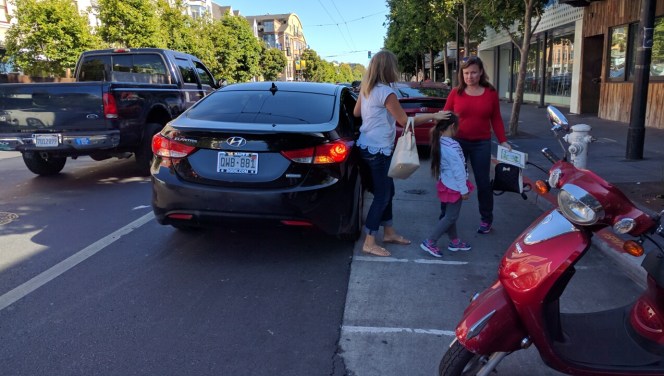
“The data is consistent with what we found. It’s nice to see this issue being taken seriously on a city-wide basis,” wrote Catherine Orland, District 9 representative to the Bicycle Advisory Committee and longtime member and volunteer with the San Francisco Bicycle Coalition. Along with a handful of volunteers, she collected data on TNC incursions into the bike lanes on Valencia Street back in 2016, to show what seemed obvious to cyclists at least–that Uber and Lyft are making it much harder and more dangerous to ride a bike in San Francisco.
And, although it doesn’t look at bike-lane incursions, the SFCTA data shows parallels. Congestion caused by TNCs on Valencia is significantly high, explained Bhargava Sana, one of the transportation planners at SFCTA who worked on the study, in a phone interview with Streetsblog. TNCs are responsible for “…between seventy and ninety percent of the congestion measured on Valencia.” It’s highest after 6:30 p.m., he added.
The SFCTA study is part of a growing body of evidence that TNCs are causing huge headaches for cities. A study in 2017 showed that TNCs account for a wildly disproportionate number of traffic citations in San Francisco. Similar studies in other cities show that Uber and Lyft, despite company claims, are increasing traffic congestion and pollution.
“Increased traffic is just one symptom of the high volume of TNCs, and I am also concerned about the quality of life and safety of our streets,” said Jane Kim, San Francisco’s District 6 Supervisor, in a statement. “This research is very helpful to our efforts to make sure state and local policy is keeping up with the rapid growth of TNCs in San Francisco so that the sharing economy doesn’t become a burden on our residents.”
A follow-up SFCTA report, expected early next year, will look at how TNCs impact transit ridership. And SFMTA is preparing a report on their effect on bus operations. One can surmise that, except where Muni lines have their own right-of-way, anything that impacts traffic is clearly going to slow buses as well and thereby generate transit delays.
“Muni is one of the slowest transit agencies in the nation, and increased congestion from all private autos–not just TNCs–are exacerbating the slow speeds,” wrote Rachel Hyden, Executive Director of the San Francisco Transit Riders, in an email to Streetsblog about the study. “SF Transit Riders are huge fans of the red carpet treatment to give Muni its own lane, which would speed things up and make transit more competitive to private autos. However, until we step up transit-only lane enforcement, we’re only going to see things get worse.”
“The report from the SFCTA confirms what most of us have known for years: there are more cars on San Francisco’s streets and many of them are there because of Uber and Lyft,” wrote the San Francisco Bicycle Coalition’s Brian Weiedenmeier in an email to Streetsblog. “Now that both companies control bike share in our city, it’s imperative that they work with us to reduce the safety risks caused by people driving on their platform.”
The SFCTA has posted an interactive map that links to the raw data behind their conclusions.

Streetsblog has migrated to a new comment system. New commenters can register directly in the comments section of any article. Returning commenters: your previous comments and display name have been preserved, but you'll need to reclaim your account by clicking "Forgot your password?" on the sign-in form, entering your email, and following the verification link to set a new password — this is required because passwords could not be carried over during the migration. For questions, contact tips@streetsblog.org.