How Dangerous Is the Driving Around Your Kids’ School?
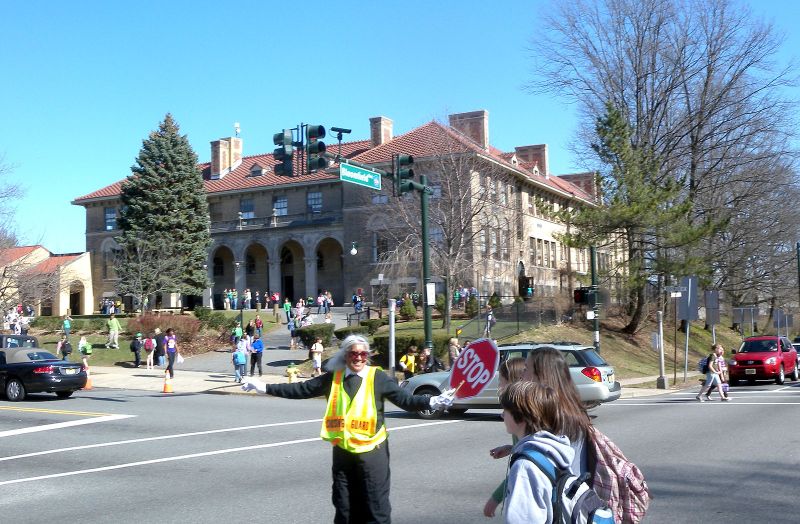
Just how bad are the drivers that zoom past your children’s school while they’re walking to class? A new map from the driving behavior analytics company Zendrive can give you a better read.
The Zendrive mobile app tracks driver behaviors like speeding, hard stops, and usage of mobile devices. Here’s how they pulled together the data for the school safety map:
Using our driving safety analytics technology, we mapped out areas around 75,000 schools nationwide and analyzed over 3.4 billion driver miles driven within them, giving us a very broad and accurate safety snapshot of April of 2017. We measured phone use while driving, as well as hard braking and fast acceleration, to get an idea of how safe the roads around schools really are. We came up with safety report cards (A+ through F, of course) for schools, counties, and states across the US.
Overall, Zendrive found that students at urban schools tend to be more exposed to dangerous driving behaviors. Here’s where the five safest and five more dangerous schools were located:
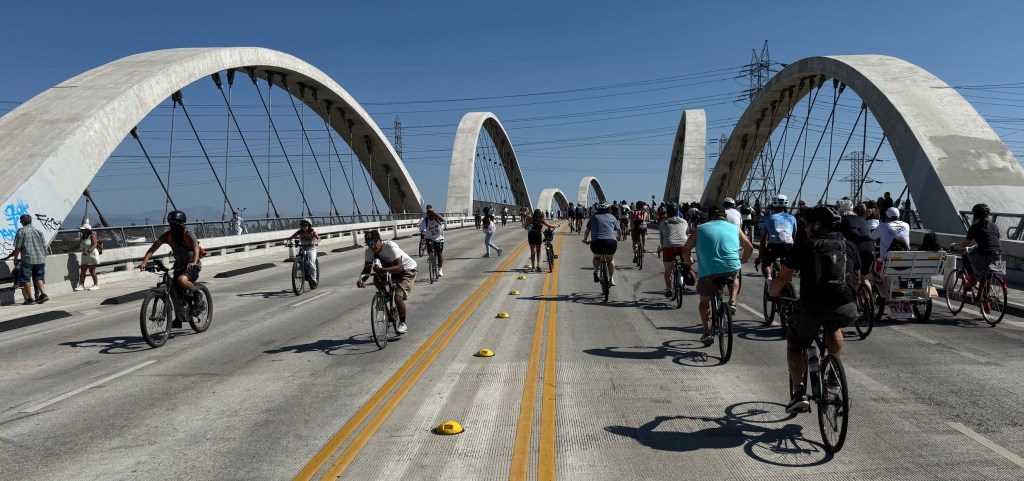
More recommended reading today: The Transportist shares a study affirming that there’s “safety in numbers” for people on bikes. And Streets.mn ponders one think tank’s informed guesswork about the transition from car ownership to “transportation as a service” might play out.

Streetsblog has migrated to a new comment system. New commenters can register directly in the comments section of any article. Returning commenters: your previous comments and display name have been preserved, but you'll need to reclaim your account by clicking "Forgot your password?" on the sign-in form, entering your email, and following the verification link to set a new password — this is required because passwords could not be carried over during the migration. For questions, contact tips@streetsblog.org.