San Diego’s Bike Ridership Is Evolving, Not Declining. Here’s What SANDAG’s 2025 Commute Report Really Tells Us

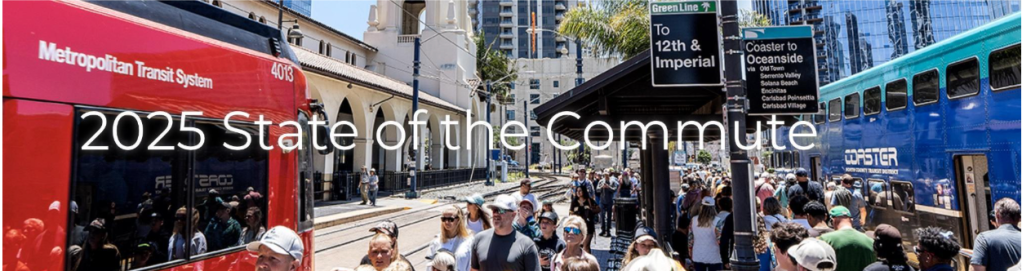
Every year, I look forward to the San Diego Association of Government’s (SANDAG’s) State of the Commute report, mostly to see what’s happening with biking in San Diego.
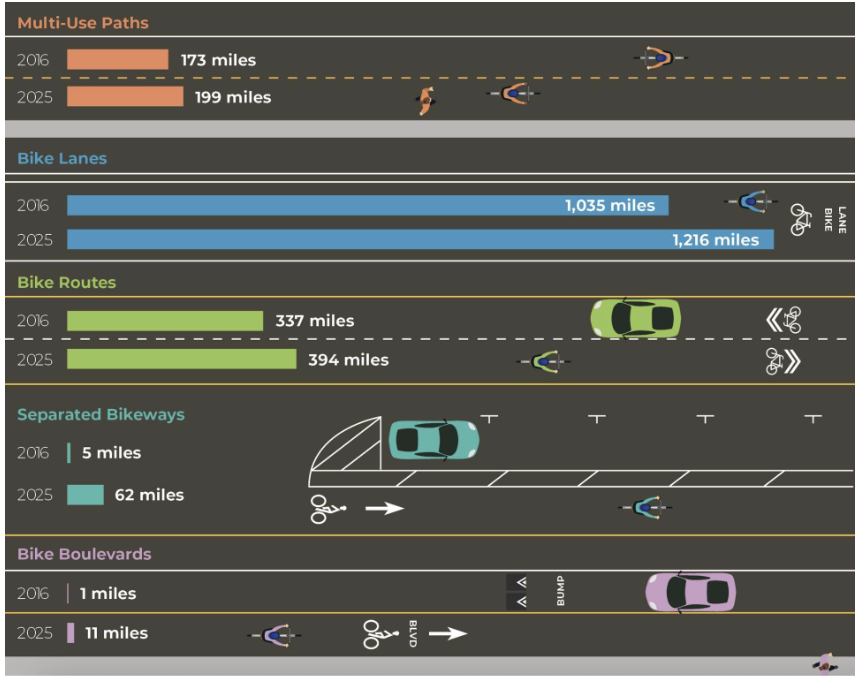
One number jumps out: the report states that bike activity is down 5% from 2024. But the report also has some good news, the region now has 1,881 centerline miles of bikeways, with more than 331 miles added since 2016. The report lays out five classes of bikeways that are in-use in the SANDAG region, ranging from multi-use paths to bike boulevards, each designed to make riding more accessible for different skill levels.
So is biking really becoming less popular? Or is something else going on?
The report’s own footnotes tell the full story. The dip isn’t a sign that fewer people are biking. It’s a sign that riders are spreading out, choosing safer routes, and the data collecting system is still catching up to the region’s infrastructure progress.
The Numbers Are Down – By Design
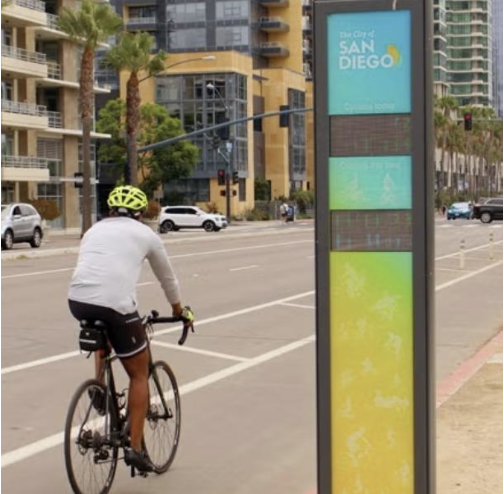
So how does SANDAG actually count bikes? They’re not tracking every rider, that would be impossible. Instead, they rely on a small network of Eco-Counters placed along eight specific corridors that are used for this annual comparison. These were carefully selected to provide a consistent, long-term comparison point, a job they do well.
However, as SANDAG openly notes in Endnote 12, there are limitations:
“Data validation and reconstruction were performed to address count gaps and anomalies caused by bicycle sensor malfunctions and roadway construction activities which affected data collection for University Avenue in 2025.”
In short, the stated 5% decline reflects local conditions at a specific moments in time more than regional trends. Credit to SANDAG for being upfront rather than sweeping it under the rug.
The Bigger Picture: Bike Riding Still Way Up from 2019
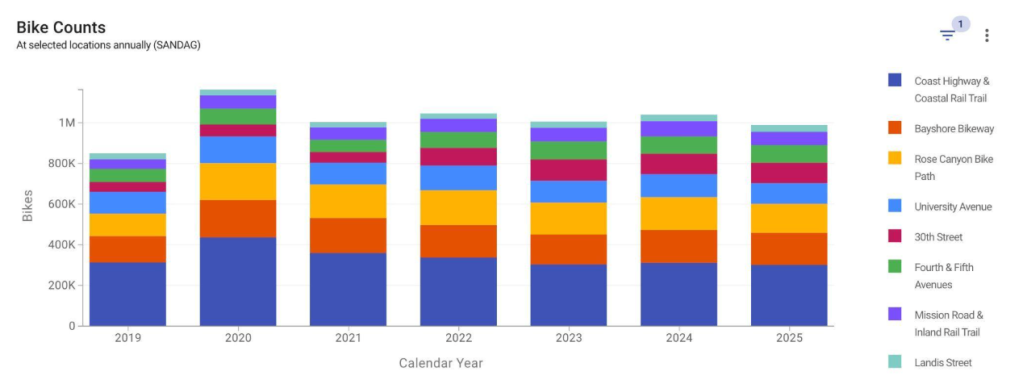
Despite the year-over-year fluctuation, bike activity across those same eight monitored corridors is still 17% higher than pre-pandemic levels in 2019.
The 30th Street protected bike lanes in North Park saw a 15% ridership increase in 2025 – their fourth straight year of growth. And they’re not alone. The Bayshore Bikeway and Rose Canyon Creek path see hundreds of thousands of riders annually.
Even with limited sensors and their hiccups, construction blockages, and riders redirecting to what they perceive to be safer or quicker local streets, the long-term trend is unmistakably positive. More people are choosing bikes and doing it on infrastructure that didn’t exist a decade ago. So we need to do more.
What This Really Tells Us
In summary, SANDAG’s report doesn’t show a system in decline. There are 1,881 miles of bike infrastructure, smarter riders choosing safer local streets instead of areas where checkpoints that were setup years ago, and data that’s refreshingly honest about its own limits. And through it all, the long-term trend is still up.
If you ride in San Diego, you already know the truth: more people are out there on bikes of all types. From the Bayshore Bikeway to the Coastal Rail Trail, on the new boulevards, or the neighborhood streets that feel calmer.
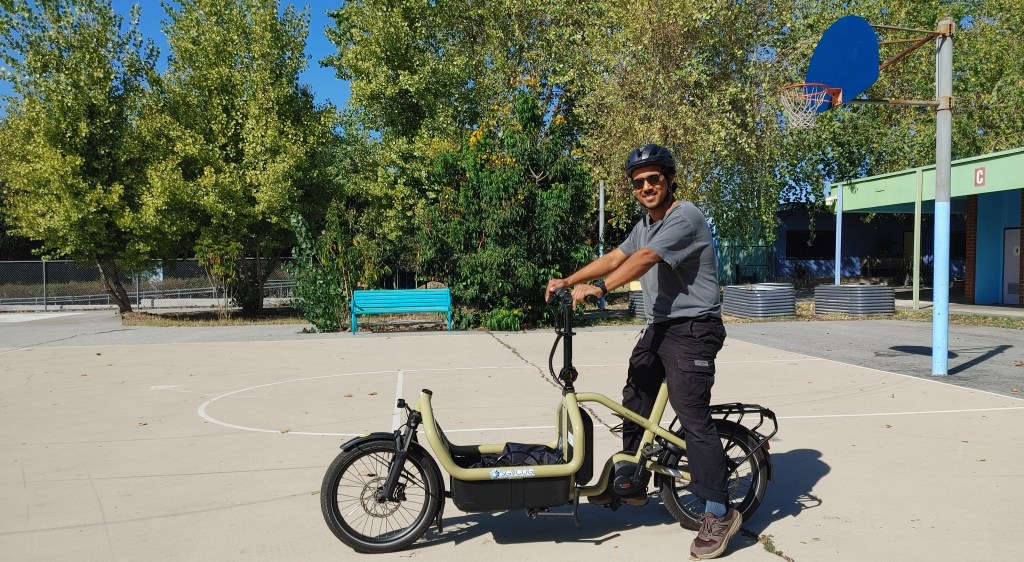
I see them on bike rides every day. I’m a bike commuter and have personally served as an ambassador for neighbor bike purchases more times than I can count. With thousands of miles biked over the past year, I’ve recruited numerous San Diegans to take up biking for the first time, or to ride more than they ever have before.
And the benefits go beyond the wallet. Every person on a bike is one less car in front of you, one less tailpipe puffing emissions, and one more person getting fresh air and exercise. Beyond the cost savings, there’s cleaner air, less car traffic, and the mental clarity that comes with a morning or evening ride. That’s good for the city, good for the climate, and good for the rider.
The Bigger Picture
The numbers in this report, read carefully, back up what we’re seeing on the ground. With 1,881 centerline miles of bikeways (over 331 have been built since 2016 per the report) the region has built more lanes. And riders are using them, just not always where the old counters are looking.
There are still gaps to close, streets to calm, and riders to welcome. But if this report shows us anything, it’s that San Diego can move in the right direction. Let’s keep the momentum for every rider, every neighborhood, and every mile ahead.
Want to dive deeper? The full 2025 State of the Commute report is available on the SANDAG Open Data Portal, including interactive maps and detailed route-level data. Or explore the San Diego Regional Bike Map to see where all 1,881 miles of bikeways are located.

Streetsblog has migrated to a new comment system. New commenters can register directly in the comments section of any article. Returning commenters: your previous comments and display name have been preserved, but you'll need to reclaim your account by clicking "Forgot your password?" on the sign-in form, entering your email, and following the verification link to set a new password — this is required because passwords could not be carried over during the migration. For questions, contact tips@streetsblog.org.