Post-COVID Metro Transit Ridership Recovering, While Service Lags
Metro transit ridership is gradually recovering from a roughly 70 percent drop under COVID. By March, many bus lines were operating at about two-thirds of pre-COVID levels. The state and county’s relatively rapid steps toward re-opening are proceeding more quickly than Metro’s slow crawl to restore transit service. The result is likely to be overcrowded buses.
For context, below is a graph of L.A. COVID-19 cases.
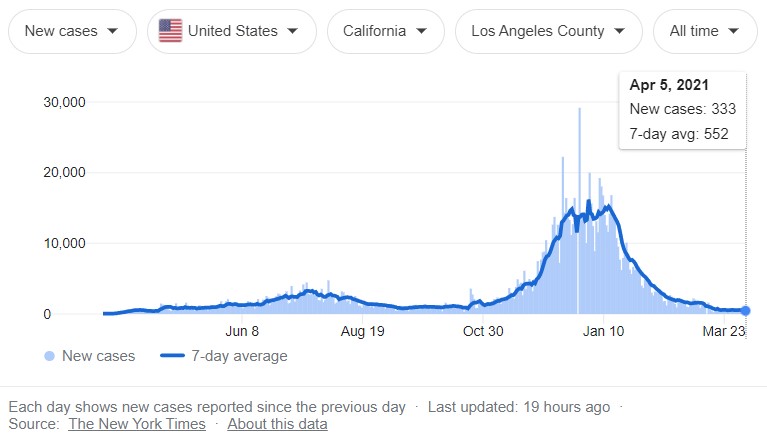
Here the pandemic got underway in March 2020, then peaked in the summer, and spiked most dramatically from December 2020 through January 2021.
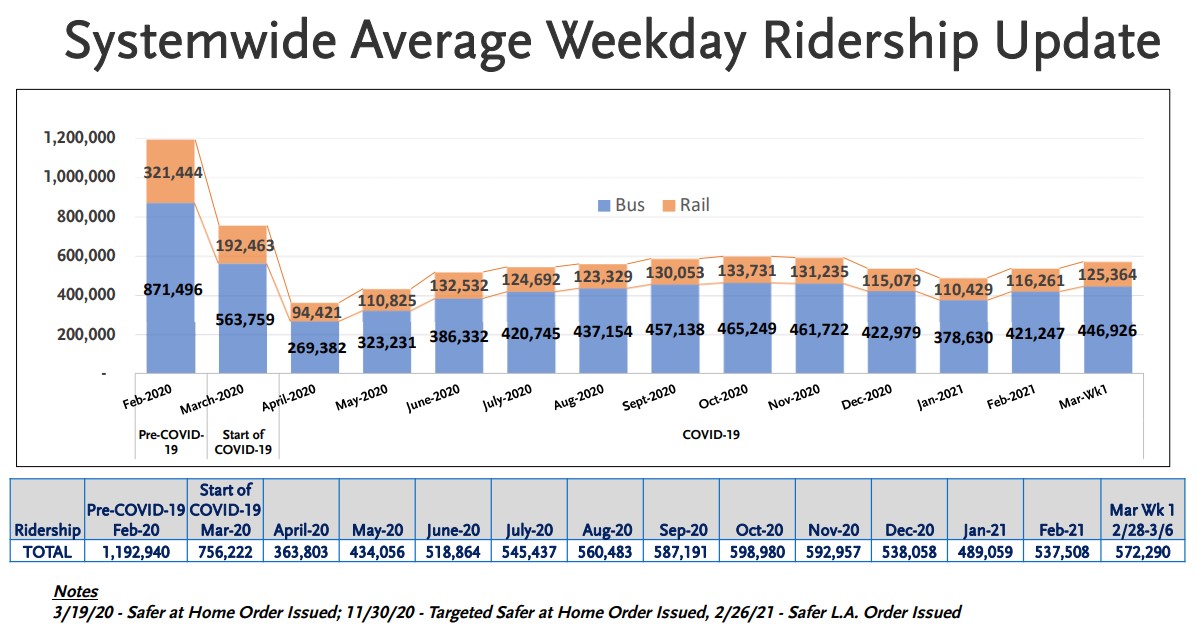
Metro transit ridership dropped significantly under COVID-19. In 2019, the system saw about 1.2 million weekday daily riders. This continued through February 2020, then, during the first wave of the pandemic, quickly dropped by about 70 percent to ~360,000 daily riders in April 2020. During last summer and fall, ridership gradually rebounded – to a pandemic high of about 600,000 in October 2020 – essentially half of pre-pandemic ridership. Then, during the winter COVID spike, ridership dipped again.
Now, with vaccinations in full swing and cases continuing to decline, ridership is again rebounding; March ridership was again nearly 600,000 – about half of pre-pandemic levels.
One quirk in the ridership picture that hasn’t been widely noted is the differing recoveries between different transit lines .
In April 2020, Metro bus ridership dropped off almost as much as rail ridership – both about 70 percent. Rail dropped to 29.4 percent of February totals, while bus ridership declined slightly less – to 30.9 percent. Then bus ridership rebounded somewhat more quickly than rail. The most recent (March 2021) data shows that bus ridership has risen to just over half (51.3 percent) of pre-COVID levels, while March 2021 rail ridership is at just 39 percent. [See bus/rail comparison spreadsheet]
Despite bigger ridership declines on rail, initially Metro made deeper COVID cuts to bus service (cut by 29 percent) than to rail (cut by 14 percent). In September, when the Metro board approved its FY21 budget with overall 19.2 percent service cuts, the bus cuts (20.3 percent) were again deeper than rail cuts (12.4 percent). [See FY21 budgeted service hours spreadsheet]
Now, thanks to geophysicist Ian Rose, there is granular data comparing different bus lines throughout the Metro system. Rose compared March average weekday ridership for February 2021 vs. calendar year 2019.
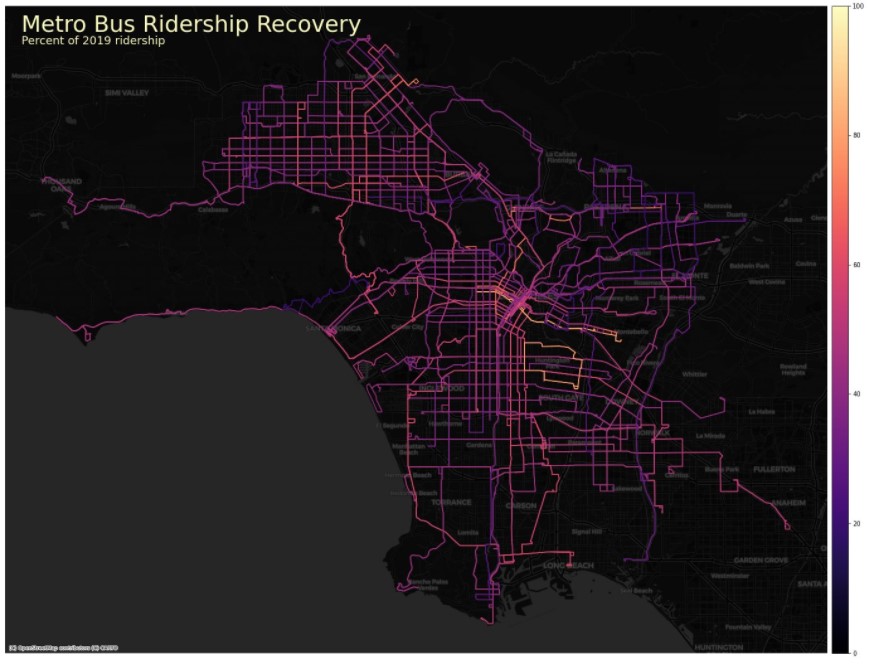
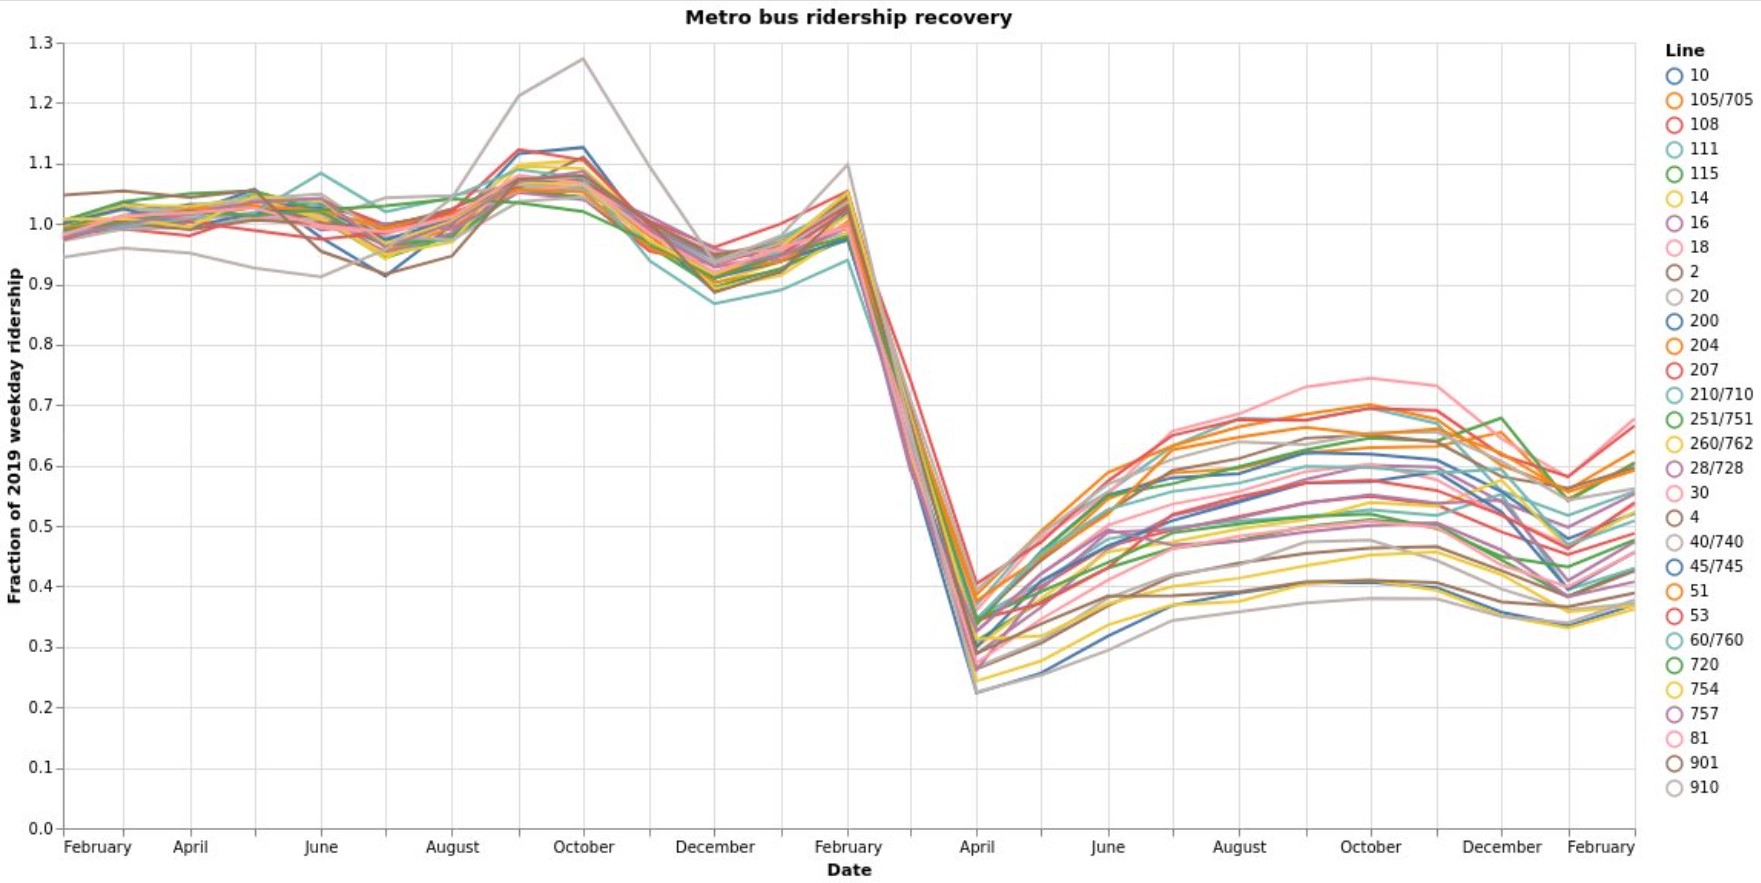
Though overall bus ridership has recovered to just over 50 percent of pre-COVID levels, a few bus lines are already recovered to nearly 80 percent of pre-COVID ridership. Others have only recovered by 20 percent or so. Rose notes that “lines in South and East L.A. have recovered more of their ridership than in most other areas.” Broadly, it appears that lines that carried high numbers of students and office commuters have recovered less than others that presumably serve lower-income essential workers.
According to Rose, the Metro bus lines with the highest recovery are:
- Line 66 (East Olympic) – 79 percent
- Line 611 (Huntington Park) – 78 percent
- Line 94 (San Fernando Blvd) – 74 percent
Rose also looked at Metro’s 30 highest-performing lines pre-COVID. These lines carry the bulk of Metro ridership. Their recovery percentages vary quite a bit too.
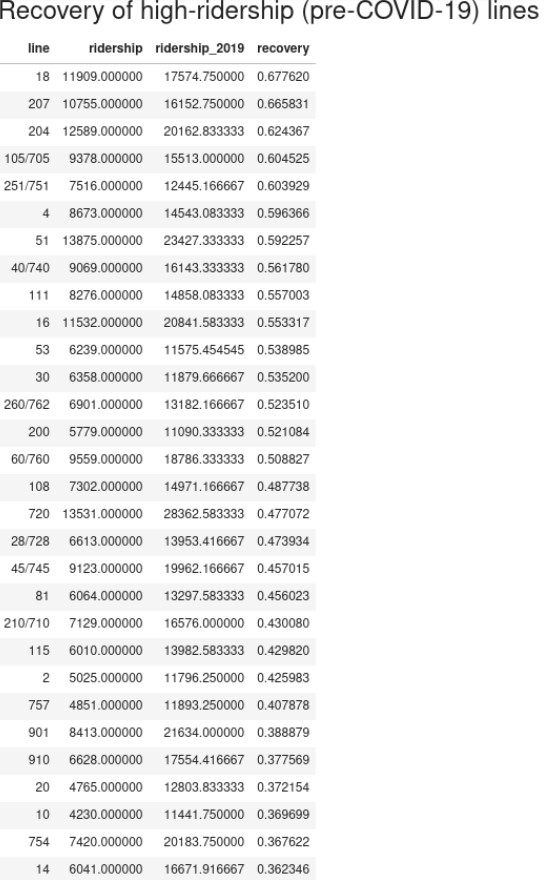
Of those workhorse lines, the highest most recovered are:
- Line 18 (Whittier Blvd) – 68 percent
- Line 207 (Western) – 67 percent
- Line 204 (Vermont) – 62 percent
- Line 105 (Vernon) – 60 percent
- Line 251 (Soto) – 60 percent
So, what will happen as ridership rebounds?
Schools are reopening this month. The state is now planning a full reopening in June.
But despite advocacy and a board mandate, Metro “bus service set to increase in June and then return to normal levels in September” per The Source and the board’s stepped-back mandate.
Between now and September buses are going to get crowded.
There are perhaps a couple of silver linings to this gray cloud:
Per a Metro presentation, Metro is already working to restore service back to where the agency was a year ago. Metro has received over 860 bus operator applications and begun operator training classes. Metro seeks to employ 100 new bus operators per month, beginning this month.
Once regular boarding resumes, Metro fares and passes will be half-off for at least six months – under a program approved in May 2020. This will be a big cost savings for Metro riders, but could also increase that crowding.

Streetsblog has migrated to a new comment system. New commenters can register directly in the comments section of any article. Returning commenters: your previous comments and display name have been preserved, but you'll need to reclaim your account by clicking "Forgot your password?" on the sign-in form, entering your email, and following the verification link to set a new password — this is required because passwords could not be carried over during the migration. For questions, contact tips@streetsblog.org.