The decline is small in number, but in the scheme of things, it's huge: New census data [PDF] out last week show car commuting among Americans is finally, after decades of growth, starting to reverse itself.
Driving to work is still the predominant mode to a depressing extent. Almost nine in 10 Americans get to work by car and about three in four drive alone. But those numbers are beginning to fall.
Since 1960, the percent of Americans driving to work rose from 64 percent to a high of 87.9 percent in 2000. Since then, it has declined slightly but meaningfully to 85.8 percent. The percent of the population commuting by car ticked down again in 2013, the latest year for which numbers are available.
Even solo car commuting is down from its high in 2010 of 76.6 percent. Despite a precipitous decline in carpooling, solo car commuting was down to 76.4 percent in 2013, after two decades of rapid growth.

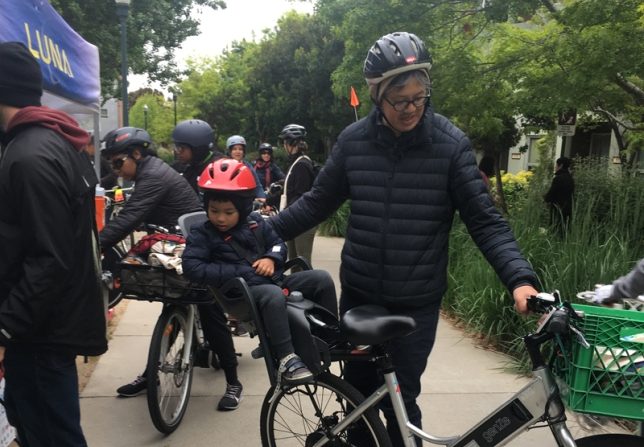
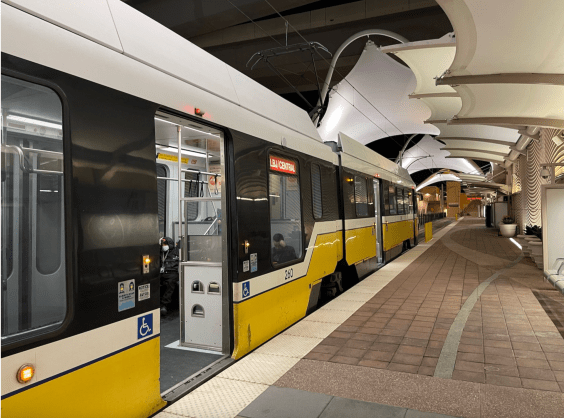
The decline was led by younger people and those living in central cities. City residents ages 25 to 29 registered a 4 percentage point dip in car commuting between 2006 and 2013 -- the most by far of any group, the Census Bureau reports. Among this group, the number of people who commute by transit increased from 5.5 percent to 7.1 percent. Bike commuting appears to have played a role as well, increasing 0.3 percentage points for workers between 25 and 34.
"The likelihood of driving alone to work increased with age," wrote Brian McKenzie, who compiled the report for the Census Bureau.
Leading the way were some of the nation's largest cities, college towns, and other metros that have made significant investments in transit, including San Francisco, Boston, Seattle, Philadelphia, New York, and Raleigh. In the New York metro area, for example, car commuting dropped nearly a full percentage point since 2006.


