More Californians Are Commuting by Bike
The Alliance for Biking and Walking just published its 2016 Benchmarking Report, which ranks states and cities on key statistics including the percentage of people commuting by bike. Every biannual report is a little bit different, as states develop their data collection and the Alliance is better able to compare statistics across fields.
California’s bike commute mode share now ranks fourth among the fifty states, up from sixth in 2014. At 1.1 percent of all California commuters, the number of bike commuters is slightly up from the 1 percent in the 2014 report. But it still has a ways to go to get to the tripling of bike mode share that Caltrans and the California Bicycle Coalition have set as goals for the state (to 4.5 percent of all trips by 2020).
The Alliance’s Benchmarking Report promotes good data collection about bicycling and walking, and makes that data available to support informed decisions about policy, infrastructure, and funding. It also seeks to make the connection between health and active transportation. To that end this report includes data about health markers including obesity, diabetes, and hypertension.
There are caveats. For one thing, the data is very general, comparing population-wide statistics that may or may not have a causal relationship. It is also limited by its sources; for example, the bike and pedestrian mode share data comes from the U.S. Census, which limits travel mode questions to the commute trip. This not only leaves out the considerable number of other trips people make—thus likely undercounting these modes in particular—but the census only gives people one choice when they answer, so that a person who walks to transit will report that as a transit trip, not a walking trip.
Furthermore, much of the data is self-reported. It is not necessarily wrong, but in some cases it can be inconsistent, especially when comparing between different states.
Keeping these caveats in mind, the Alliance’s Benchmarking Report is still a key source of nationwide data about bicycle and pedestrian trips. Though more and better data is needed, this report is a great place to start and getting better every time.
California’s 1.1 percent bike commute mode share is smaller than cyclists want it to be, but it is nothing to sneeze at. California is, by a long shot, the most populous state in the nation. At 38 million, CA is 12 million more than the next most populous state, Texas—which only has a 0.3 percent bike commute mode share. At 1.1 percent, that’s a lot more bicycle commuters on our roads than in many other states.
The report has a fascinating story to tell, buried in its statistics, about poverty, gender, race, and mode choice was well. For example, overall 16 percent of California commuters are low income, but 31 percent of commuters who walk to work are low-income, and 27 percent of commuters who take transit are low-income. The report finds that, in general,
Bicycling and walking rates are influenced by a wealth of interlocking factors, from household income to community density. Perhaps surprisingly, some of the states with the highest levels of biking and walking are not among those states that are most urban and most dense. Unsurprisingly, states that spend more general revenue per capita on biking and walking do tend to have higher rates of active transportation, as do states with a lower percentage of the populations in poverty.
Women are underrepresented as U.S. bike commuters, but one California city stands out. Oakland is the closest of all the U.S. cities studied to reaching gender parity; 38 percent of bike commuters there are female. Well, Virginia Beach, VA has a slightly smaller gender difference, but it also has a smaller bike commute mode share than Oakland. So there.
The report makes connections between health indicators and active transportation as well.
Data suggest a strong relationship between statewide percentages of bicycling and walking to work and key public health indicators. States with higher levels of bicycling and walking to work see lower levels of diabetes, obesity, and high blood pressure. Unfortunately, every state saw a rise in each disease, but the smallest increases were seen in states with higher levels of walking and biking, including Colorado, Hawaii, and Montana.
That would also include California, which has a higher-than-average percent of people who either walk or bike to work (3.9 percent, vs. the national average of 3.4 percent) and slightly less-than-average rates of obesity, hypertension, and diabetes.
Of course these numbers do not necessarily show causality, but it is interesting to note that the report sees consistency in the relationships between these bits of data across states.
The report also looks at city data. Below are the key rankings for California cities in the 2016 report.
Among the country’s most populous cities, San Francisco ranked third for walk commute, at 10.2 percent.
Also ranked in the top 20 were:
- 16th: Oakland, 4.6 percent
- 17th: Los Angeles, 3.7 percent
- 20th: Sacramento, 3.3 percent
California had more cities ranking among the top twenty for bike commute mode share:
- 4th: SF, 3.7 percent
- 6th: Oakland, 3 percent
- 9th: Sacramento, 2.3 percent
- 15th: Los Angeles, 1.1 percent
- 16th: Fresno, 1.1 percent
- 18th: Long Beach, 1 percent
Among smaller cities, Davis, at 20.3 percent bike mode share, was far and away the top U.S. city, far higher than number two Boulder, where 10.8 percent of commuters ride bikes.
If you add in transit, San Francisco comes in fourth after New York, D.C., and Boston, with 46.4 percent of commuters either walking, biking, or taking transit. Also in the top 20 for all three modes:
- 8th: Oakland 26.3 percent
- 13th: LA 15.8 percent
- 19th: Long Beach 11.3 percent
Some of these high-ranking cities also have fewer bike-ped deaths. The number of bike-ped fatalities per 10,000 commuters may be the most telling statistic in the report. What is the relationship between the number of people who bike or walk and the number of traffic deaths involving bike riders or walkers? San Francisco ranks fifth among U.S. cities, with only 2.8 fatalities per 10K commuters, and Oakland ranks 15th with 7.4. Among smaller cities, Davis ranks third nationally–behind Burlington, VA, and Fort Collins, Colorado–with 0.9 fatalities per 10K commuters.
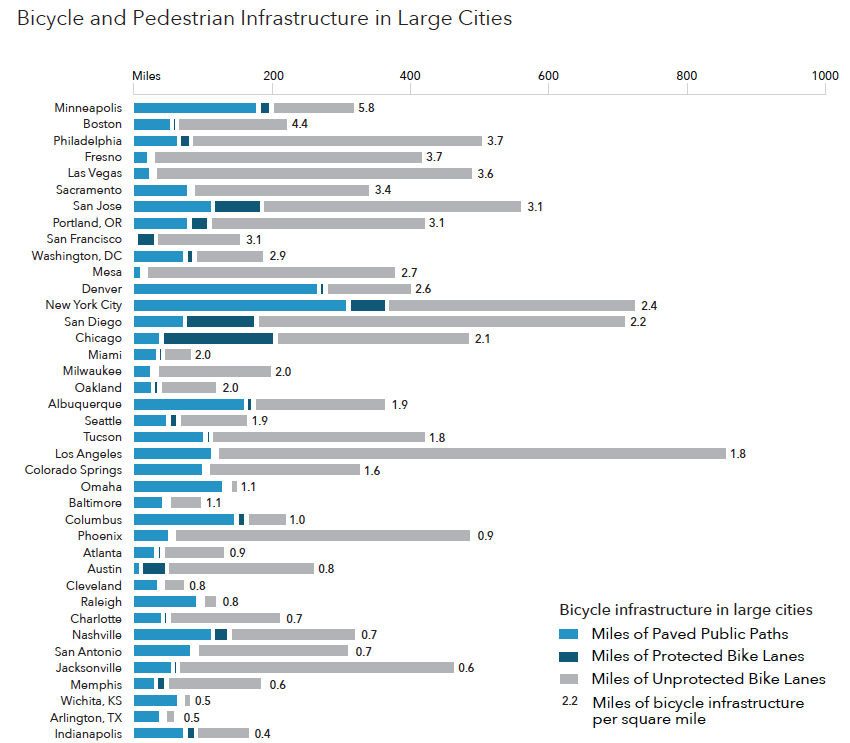
The city of Los Angeles ranks first nationally with the highest overall miles of bicycle infrastructure, though the total is less impressive when divided by the city’s area. At 1.8 miles of bike lanes per square mile, L.A.’s is not among the highest density networks. Also, its bikeway mileage is mostly unprotected bike lanes. Chicago tops the number of miles of protected bike lanes at 161 miles, but San Diego comes in 2nd overall with 99 miles of protected bike lanes, and San Jose is third with 66 miles. For some reason, Long Beach’s information is missing from the chart, but it is likely to rank high.
The Benchmarking Report connects its rankings to city and statewide policies, funding, and in general how much attention is paid to biking and walking as travel modes. These are harder to compare, as they differ widely among states, and because here the self-reporting issue makes a bigger difference. That said, California, while not perfect, has been making some efforts in these areas. It lacks a few key policies, like a bike plan (but it’s working on that), but has adopted complete streets and smart growth policies, for example, that help encourage biking and walking.
You can peruse the report here. You’ll find all kinds of other information, including a chart on page 151 that is a first stab at collecting information about which cities have bike-share or are planning it.

Streetsblog has migrated to a new comment system. New commenters can register directly in the comments section of any article. Returning commenters: your previous comments and display name have been preserved, but you'll need to reclaim your account by clicking "Forgot your password?" on the sign-in form, entering your email, and following the verification link to set a new password — this is required because passwords could not be carried over during the migration. For questions, contact tips@streetsblog.org.