Note: GJEL Accident Attorneys regularly sponsors coverage on Streetsblog San Francisco and Streetsblog California. Unless noted in the story, GJEL Accident Attorneys is not consulted for the content or editorial direction of the sponsored content.
Street Story, which launches today, is a community engagement tool developed at the University of California Safe Transportation Research and Education Center (SafeTREC.) The online mapping tool is designed to help local advocacy groups, city planners, and state agencies easily collect and analyze information about pedestrian and bicyclist safety. It is a statewide map and survey in which people can report collisions, near misses, and safety hazards, as well as mark and discuss places where they feel safe traveling by foot or bicycle or scooter. The survey has space for people to tell a story about their experiences, including any details they believe are important.
The information will be gathered anonymously, and made available to the public. Anyone will be able to generate local, regional, or statewide maps of hot spots, crash types, and safety hazards. The tool is designed to be easily accessible for community groups and individuals, to help understand, count, and map safety issues in their communities. The information can be used for transportation safety needs assessments, program development, grant writing, planning, and the like, as well as by advocates who want to bring attention to hazards.
Kate Beck of SafeTREC, who has been developing Street Story for the past year or so, says a key motivation was making it a tool for real community engagement. The idea is both to improve the quality of safety data collected as well as to enhance communication between planners and communities. “We wanted to create a more complete picture of safety” than is generally available from current data sources, she said. “The stories of what happens in a collision—or a near miss—tend to get lost,” she said. “We were looking for a way to collect the stories themselves and give them more weight” in discussions about safety improvements.
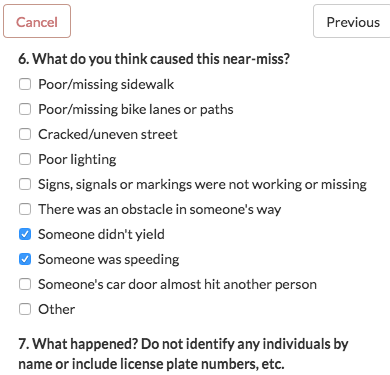
Street Story's short survey includes a multiple-choice question about what people believe is the cause of the collision, near-miss, or safety hazard they are reporting, and space for adding details. The information collected goes into much more detail than what can be extrapolated from existing data sources such as SWITRS--although it is not a substitute for reporting a crash to the police. SWITRS, the Statewide Integrated Traffic Records System, remains the state's official dataset for crashes. SWITRS collates data from police reports. It has long been considered the sole source of consistent and relatively-reliable crash data. However, it has many shortcomings, including some incomplete and/or inaccurate reports, a long time lag before data is available, and an interface that is not user-friendly.
In addition, near-misses are completely absent from SWITRS. But they are important for planners to know where and why they happen. Dangerous driving behavior can be part of a culture that makes streets much less safe for people outside of cars, but while it can deter people from walking or riding a bike, it is difficult to track. Similar projects in Victoria, British Colombia called BikeMaps, and another in Portland, NearlyKilled.Me, aim to give people a way to report incidents similar to Street Story, but both seem to be limited to collecting whatever information comes in randomly online.
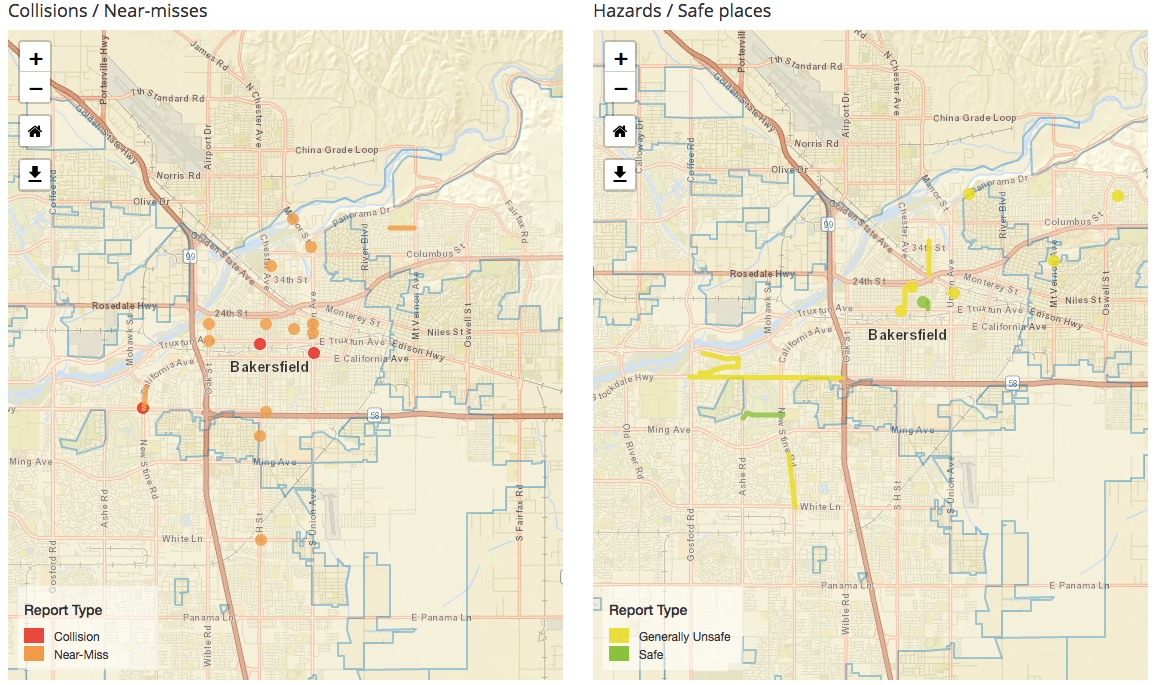
The developers of Street Story have a larger vision. They want their tool to be used by agencies and community groups both to collect information and to engage with people in the community in a deeper way than is required by checking off the "public outreach" box in planning. In the process of building and testing Street Story, they worked out kinks using prototypes in Bakersfield, Kern County, Emeryville, and Hayward. In Bakersfield, SafeTREC worked with Bike Bakersfield to gather public feedback, and local agencies there intend to use the data collected for several planning efforts, including an application for funds from the Active Transportation Program.
SafeTREC researchers are aware of problems with using an online interface for data collecting, and have taken steps to avoid some of them. For example, similar data collection efforts have found that older white males respond disproportionately to online surveys, which tends to minimize other community member voices. The developers offer a “Street Story Starter Guide” that discusses how to avoid some of these problems. They are also working on a paper version of the tool, to make it available to people who don't have access to a computer, and a Spanish language version.
They will also collect demographic information to measure how well they are achieving a balance in responses. That information will be made available to the public once there is enough data collected in any particular area for it to be made anonymous.
Beck will introduce Street Story tomorrow at the Peds Count! Summit in San Jose (at 4:30 p.m. in a session entitled “Emerging Trends and Innovations For Safer Streets”).
Street Story launches today, and is available here.