The State of American Infrastructure Spending in Four Charts
If you've checked the news on the subject of American transportation infrastructure lately, you've probably heard that the sky is falling. It's true that Congress can't get its act together and pass a decent transportation bill, but the amount of money that's being spent isn't the problem so much as the fact that we're spending it on expanding highways instead of keeping the stuff we have in good shape.
A new report from the Congressional Budget Office adds some useful perspective on public infrastructure spending (federal, state, and local, including water infrastructure) since 1956 [PDF]. Here are four major takeaways.
Infrastructure Spending is Fairly Stable as a Share of GDP
Measured as a share of Gross Domestic Product, public infrastructure spending has been fairly stable throughout the last six decades at about 2.4 percent, reports the CBO. The most recent bump came in 2009 and 2010 because of the stimulus package, when it rose to 2.7 percent. It has declined somewhat since 2011.

But Costs Have Climbed
Beginning in 2003, the cost of raw materials like concrete and asphalt increased more rapidly than the prices of other goods, the CBO reports. So if you factor in these specific costs, inflation-adjusted public infrastructure spending has declined about 9 percent since 2003 (the dark blue line).

Highways Are the Biggest Category of Spending
Of the $416 billion spent on infrastructure by federal, state and local governments in 2014, about 40 percent was dedicated to highways. About 16 percent went to transit and about a third went to water infrastructure.

Spending on Expansion Has Been Moving in the Right Direction
While state DOTs still spend many billions of dollars on highway expansions that erode their ability to maintain existing roads, the situation seems getting better. In recent years, a greater share of public infrastructure spending has been going to maintenance instead of expansion. However, it's not clear how much this trend applies to highways, since the CBO included transit and water infrastructure in this chart as well.

Read More:
Stay in touch
Sign up for our free newsletter
More from Streetsblog California
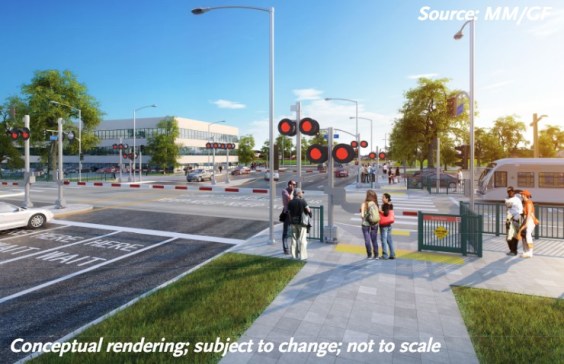
San Fernando Valley Bus/Bike Updates: G Line, Roscoe Bus Lanes, Laurel Canyon Bike Lanes
Short newly protected bike lane on Laurel Canyon Blvd, extensive NSFV bus improvements under construction this month, and scaled-back G Line plans should get that project under construction this summer
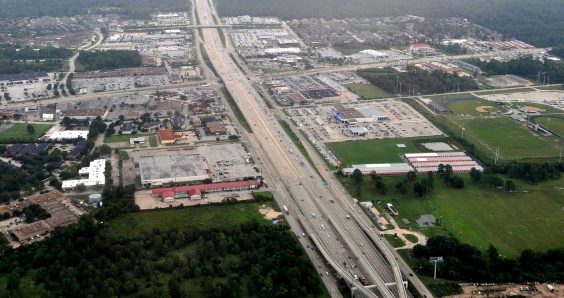
How to Fight a Texas-Sized Freeway Battle
A new book explores how Texas advocates are fighting back against destructive highway expansions. But what happened to those projects since it was sent to the printer?

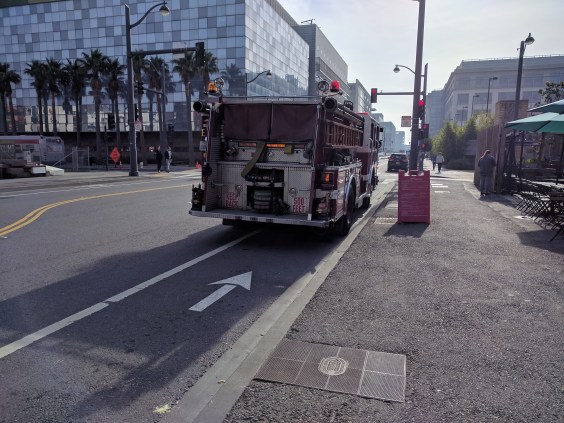
S.F. Fire Apologizes for Tweeting About Imaginary Bike Rule
There is no rule in California that says cyclists have to ride single file
Valencia Merchants to SFMTA: We Want Curbside Protected Bike Lanes
Valencia merchants association strengthens support for getting rid of the failed center-running bike lane and replacing it as soon as possible with curbside protected lanes
Tuesday’s Headlines
Silicon Valley's transit market ready to grow; CA can't afford NOT to build better bikeways; Slower speeds mean fewer deaths; More